. 2005 Mar;204(1):23-32.
doi: 10.1007/s00232-005-0743-x.

Kinetics of the reverse mode of the Na+/glucose cotransporter

Affiliations

Kinetics of the reverse mode of the Na+/glucose cotransporter

S Eskandari et al. J Membr Biol. 2005 Mar.

Abstract

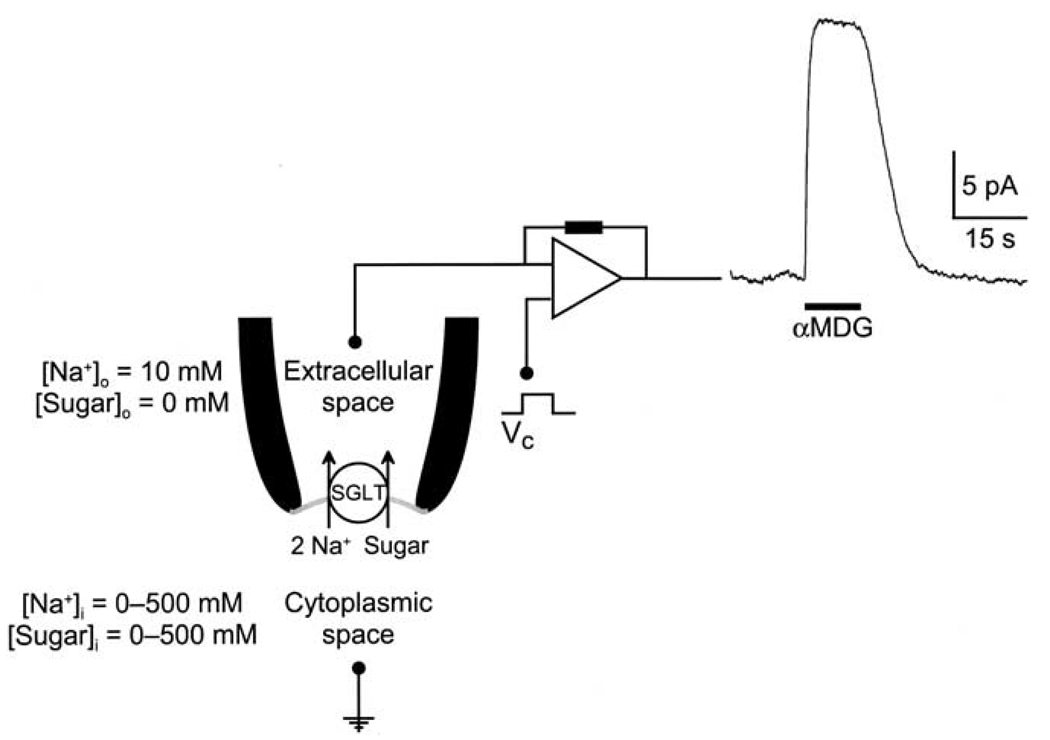
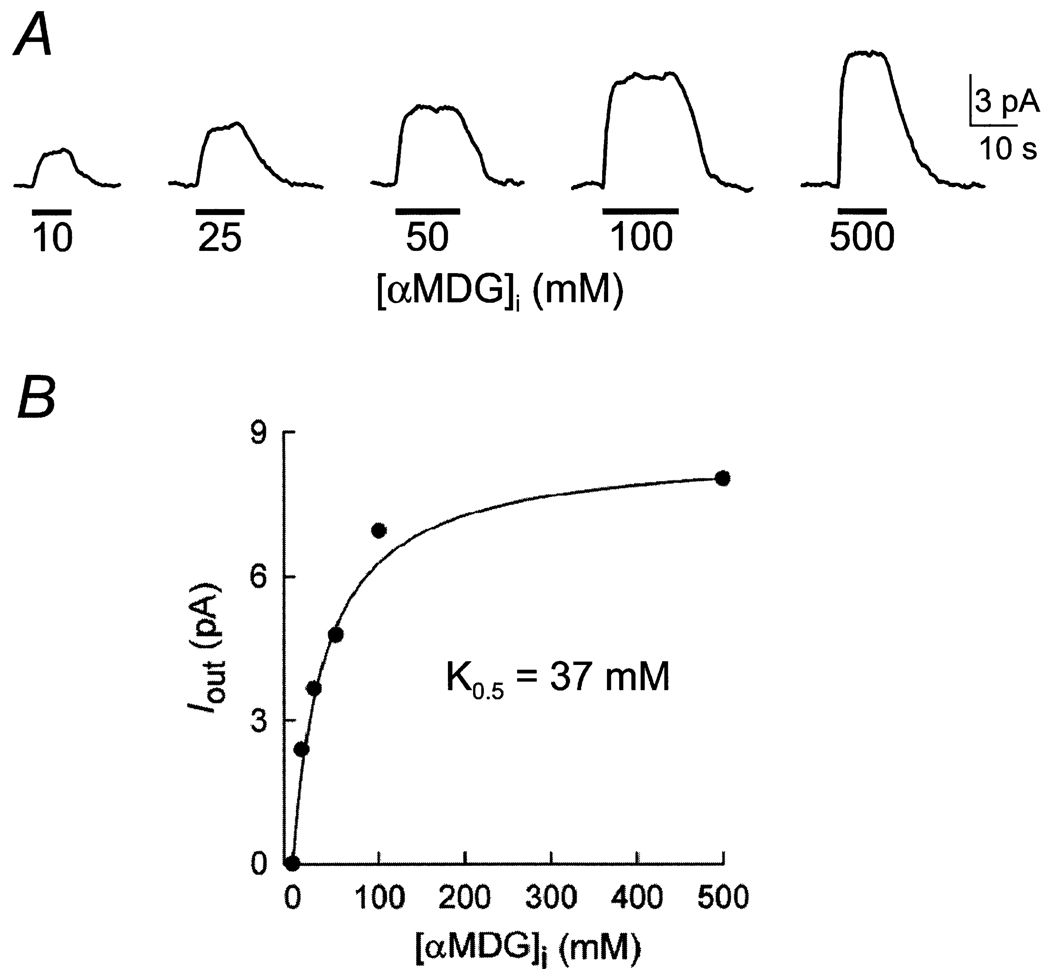
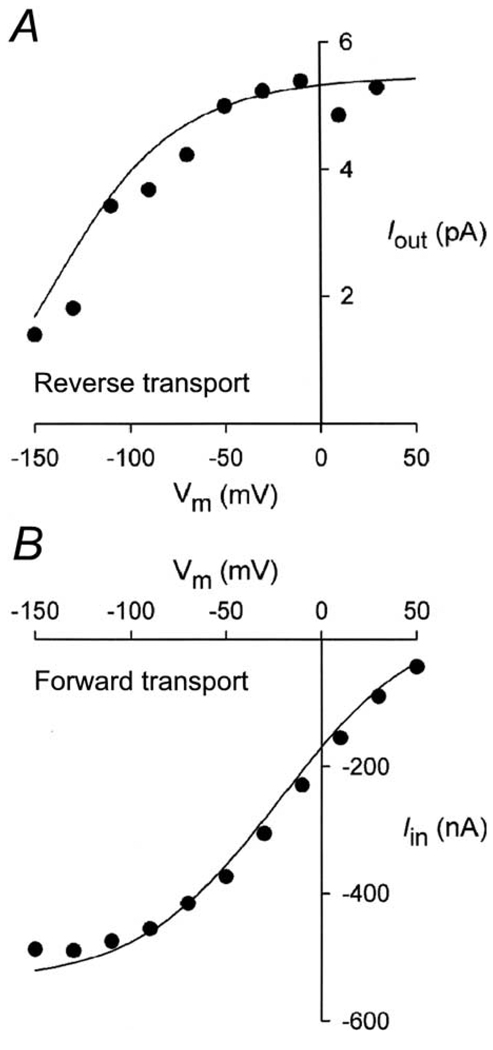
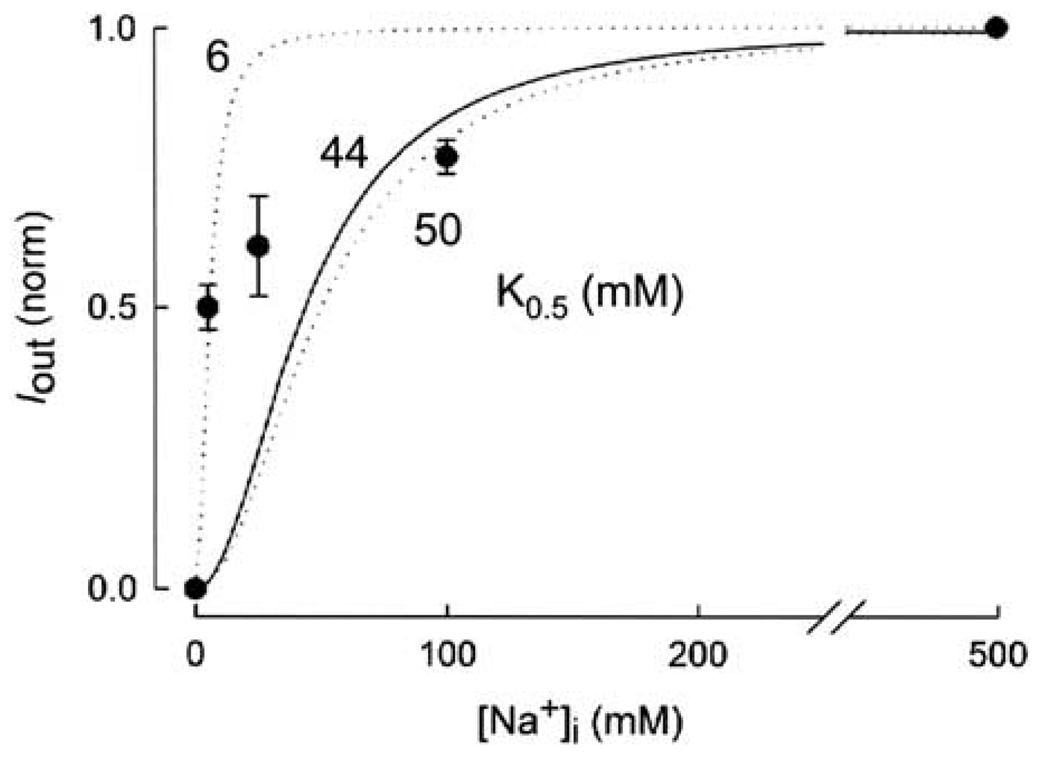
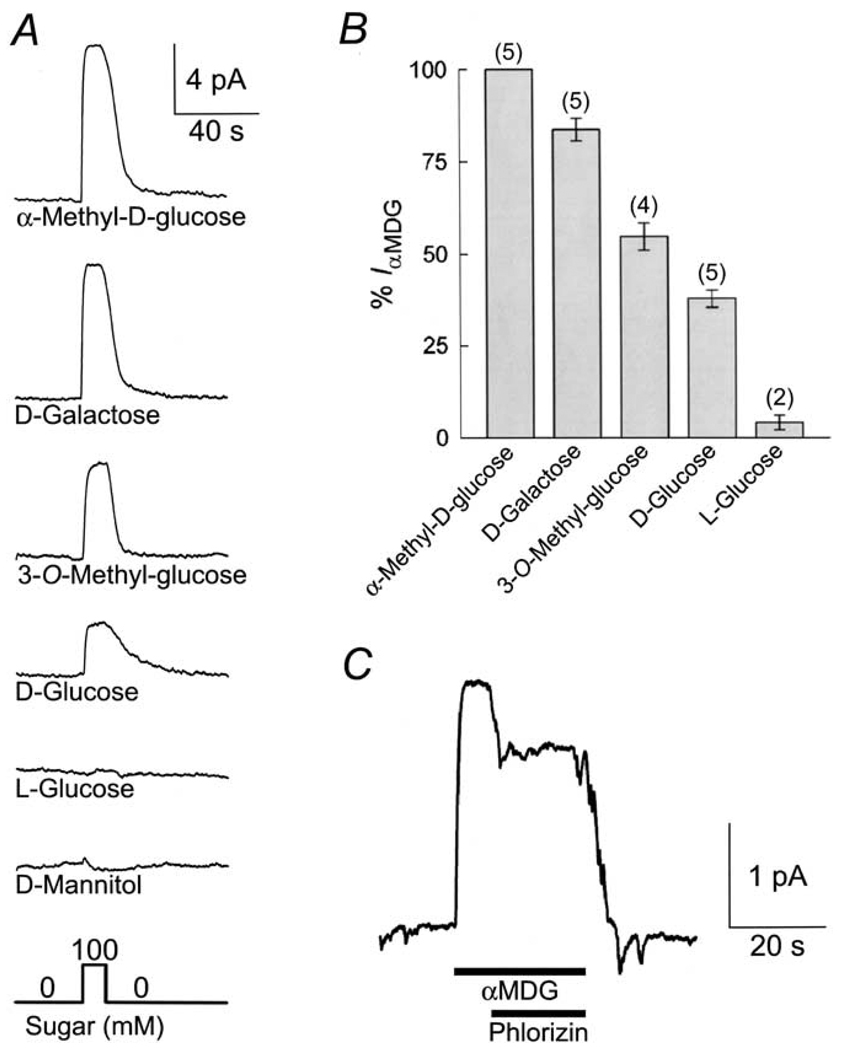
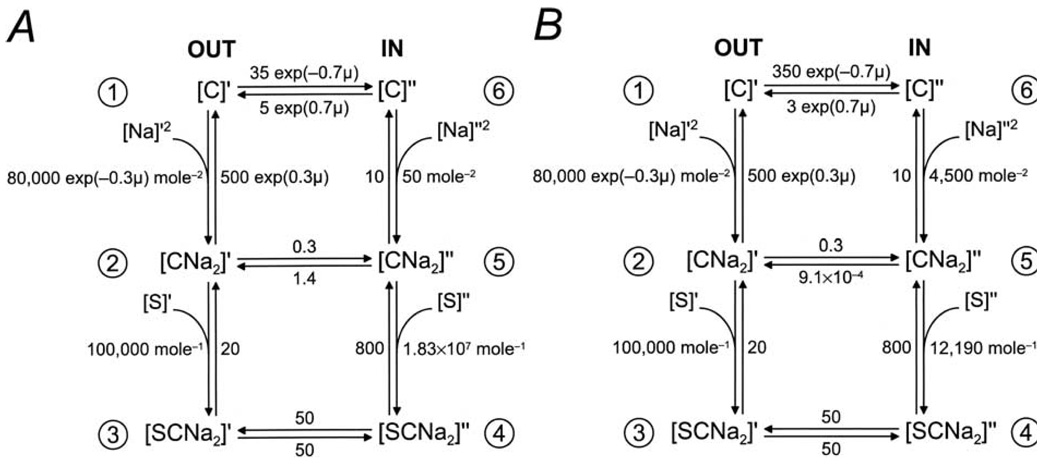
This study investigates the reverse mode of the Na(+)/glucose cotransporter (SGLT1). In giant excised inside-out membrane patches from Xenopus laevis oocytes expressing rabbit SGLT1, application of alpha-methyl-D: -glucopyranoside (alphaMDG) to the cytoplasmic solution induced an outward current from cytosolic to external membrane surface. The outward current was Na(+)- and sugar-dependent, and was blocked by phlorizin, a specific inhibitor of SGLT1. The current-voltage relationship saturated at positive membrane voltages (30-50 mV), and approached zero at -150 mV. The half-maximal concentration for alphaMDG-evoked outward current (K(0.5) (alphaMDG)) was 35 mM (at 0 mV). In comparison, K(0.5) (alphaMDG) for forward sugar transport was 0.15 mM (at 0 mV). K(0.5) (Na) was similar for forward and reverse transport ( approximately 35 mM at 0 mV). Specificity of SGLT1 for reverse transport was: alphaMDG (1.0) > D: -galactose (0.84) > 3-O-methyl-glucose (0.55) > D: -glucose (0.38), whereas for forward transport, specificity was: alphaMDG approximately D: -glucose approximately D: -galactose > 3-O-methyl-glucose. Thus there is an asymmetry in sugar kinetics and specificity between forward and reverse modes. Computer simulations showed that a 6-state kinetic model for SGLT1 can account for Na(+)/sugar cotransport and its voltage dependence in both the forward and reverse modes at saturating sodium concentrations. Our data indicate that under physiological conditions, the transporter is poised to accumulate sugar efficiently in the enterocyte.


Figures

Fig. 1
Fig. 1
Outward Na+/sugar cotransport by rabbit SGLT1. Continuous current record of an excised inside-out patch. The membrane potential (Vm) was clamped at 0 mV, and at the time shown by the bar, 100 mm αMDG was added to the external superfusing solution (internal surface of SGLT1). Sugar induced an upward deflection of the current trace, signifying an outward current (20 nA). Pipette (or external) solution contained (in mm): 10 NaCl, 90 cholineCl, 2 KCl, 1 CaCl2, 1 MgCl2, 10 HEPES, pH 7.5, and bath (or internal) solution contained (in mm): 500 NaCl, 2 KCl, 1 CaCl2, 1 MgCl2, 10 HEPES, pH 7.2.
Fig. 2
Fig. 2
Dependence of the outward current on internal sugar (αMDG) concentration. (A) Shown are current records in the same patch as various concentrations of αMDG were added to the bath solution. The experiment was performed on an oocyte expressing rabbit SGLT1. Pipette and bath solutions contained 10 and 500 mm Na+ as in Fig. 1. Membrane potential was 0 mV. (B) Relationship between the αMDG-induced outward current (Iout) and [αMDG]i. Data are from the experiment of Fig. 2A. The data followed a hyperbolic relation (Eq. 1) with a half-maximal concentration (K0.5) for αMDG of 32 ± 5 mM (standard error of the fit). The population average was 32 ± 8 mM (n = 5). The curve is the prediction of the model with the set of kinetic parameters shown in Fig. 6B with a K0.5 of 37 mM.
Fig. 3
Fig. 3
Current-voltage (I/V) relationships of the inward and outward sugar-evoked currents mediated by rabbit SGLT1. (A) I/V relation for outward current (reverse Na+/glucose cotransport). External and internal [Na+] were 10 and 500 mm, respectively. The sugar-induced current was obtained by subtracting the current in the absence of sugar from that in the presence of sugar ([αMDG]i, = 100 mm). A similar I/V relationship was obtained in four patches. (B) I/V relation for the inward current (forward Na+/glucose cotransport) from whole-cell currents using the two-electrode voltage clamp. Bath solution was the 100 mm NaCl buffer. The inward current was generated by 10 mm αMDG. The curves were model predictions from Fig. 6B scaled for the appropriate number of transporters (7 × 10¹⁰ transporters for Fig. 3B). The simulations were performed with the rate constants: k16 = 350 s−1 and k61 = 3 s−1 in A ([Na+]o = 10 mm); and k16 = 35 s−1 and k61 = 5 s−1 in B ([Na+]o = 100 mm).
Fig. 4
Fig. 4
Dependence of the outward sugar-induced currents on internal Na+ concentration. The normalized dose-response (Iout vs. [Na+]i) curve is the composite of data from four experiments with each data point representing the mean ± the standard error of 2 to 4 values. The data at 5and 500 mm Na+ were from 4 experiments. Membrane potential was clamped at 0 mV, and internal [αMDG] was maintained at 100 mm. The outward currents were measured as the internal [Na+] was increased from 0 to 500 mm. [Na+] in the pipette (external) solution was 10 mm. When the data set was fitted with a hyperbolic equation (Eq. 1), the K0.5 for Na+ was 10 ± 5mm. The two dashed lines were drawn with the Hill equation with K0.5 of 6 and 50 mM, and a Hill coefficient of 2.0. The solid curve was the model prediction using the kinetic parameters shown in Fig. 6B. The model predicted a K0.5 of 44 mM for Na+ and a Hill coefficient of 2.
Fig. 5
Fig. 5
Sugar specificity of the sugar-evoked outward current mediated by rabbit SGLT1. (A) Outward current (Iout) was measured at 0 mV in the same patch, as various sugars (100 mm) were added to the cytoplasmic surface. Pipette and bath solutions contained 10 and 500 mm Na+, respectively. (B) Comparison of the magnitude of the outward currents induced by the different sugars. The currents have been normalized to the current generated by 100 mm αMDG, and the number of experiments is indicated above the bars. No outward current was induced by d-mannitol. (C) Phlorizin (1 mm), a specific blocker of SGLT1, led to a 34 ± 3% (n = 3) inhibition of the outward current evoked by 100 mm αMDG.
Fig. 6
Fig. 6
Parameters for the 6-state ordered kinetic model for SGLT1. (A) Six-state ordered kinetic model for Na+/sugar cotransport (modified from Parent et al., 1992b). There are 6 states, the ligand-free (C1, C6), the Na+-bound (C2, C5), and the fully loaded (C3, C4) transporter on both sides of the membrane. Two external Na+ ions bind to the protein before glucose. The fully loaded transporter undergoes a conformational change to expose the bound substrates to the interior of the cell. The ligand-free transporter returns to the outside for another cycle. Membrane voltage influences the conformational change of the empty transporter and Na+ binding. The rate constants for rabbit SGLT1 were from Parent et al. (1992b), with the corrected value for k54 (1.83 × 10⁷ M−1s−1, Parent et al., 1992c). All rate constants are expressed as per second (s−1). (B) The rate constants were revised taking into consideration the experimental data obtained in this study for the reverse mode. When k65, k16, and k61 were changed to 4500 M−2s−1, 350 s−1, and 3 s−1 respectively, microscopic reversibility (Parent et al., 1992b) required that k54 and k52 be decreased to 12190 M−1s−1 and 9.1 × 10⁻⁴ s−1. The reduced potential (μ) is defined by μ = FVm/RT, where F is the Faraday’s constant, Vm is the membrane potential, R is the gas constant, and T is the absolute temperature. Simulations of the model for reverse transport are shown by the curves in Figs. 2, 3A and 4. The revised parameters predict that the sugar (αMDG) and Na+ dissociation constants (KD,s) at the cytoplasmic surface are 66 and 47 mM. On the external surface, the measured K0.5 Values (K0.5αMDG=330µM at 100 mm [Na+]o and K0.5Na=54mM at 1 mM [αMDG]o, from Parent et al., 1992b) are close to the KD values (200 µM and 79 mM).

References

    1. Abramson J, Smirnova I, Kasho V, Verner G, Kaback HR, Iwata S. Structure and mechanism of the lactose permease of Escherichia coli. Science. 2003;301:610–615. - PubMed
    1. Birnir B, Loo DDF, Wright EM. Voltage-clamp studies of the Na+/glucose cotransporter cloned from rabbit small intestine. Pfluegers Arch. 1991;418:79–85. - PubMed
    1. Chen X-Z, Coady MJ, Jackson F, Berteloot A, Lapointe J-Y. Thermodynamic determination of the Na+:glucose coupling ratio for the human SGLT1 cotransporter. Biophys. J. 1995;69:2405–2414. - PMC - PubMed
    1. Díez-Sampedro A, Wright EM, Hirayama BA. Residue 457 controls sugar binding and transport in the Na+/glucose cotransporter. J. Biol. Chem. 2001;276:49188–48194. - PubMed
    1. Eskandari S, Loo DDF, Wright EM. Functional asymmetry of the sodium/glucose cotransported. FASEB J. Abs. 1999:399.

Publication types

MeSH terms

LinkOut - more resources