

Characterization of symmetric complexes of nerve growth factor and the ectodomain of the pan-neurotrophin receptor, p75NTR
- PMID: 16009712
- PMCID: PMC1352310
- DOI: 10.1074/jbc.M503189200
Characterization of symmetric complexes of nerve growth factor and the ectodomain of the pan-neurotrophin receptor, p75NTR
Abstract
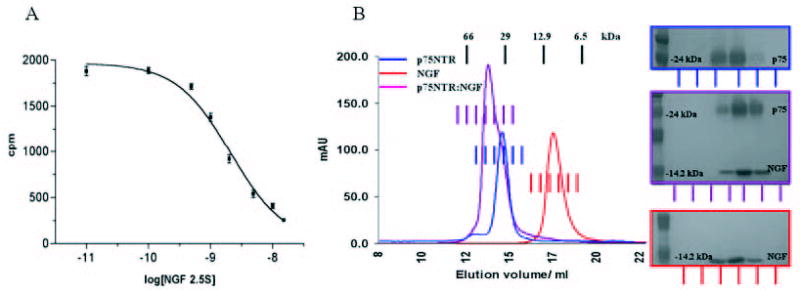
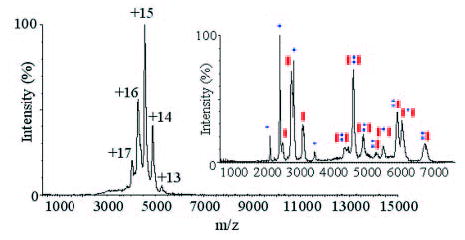
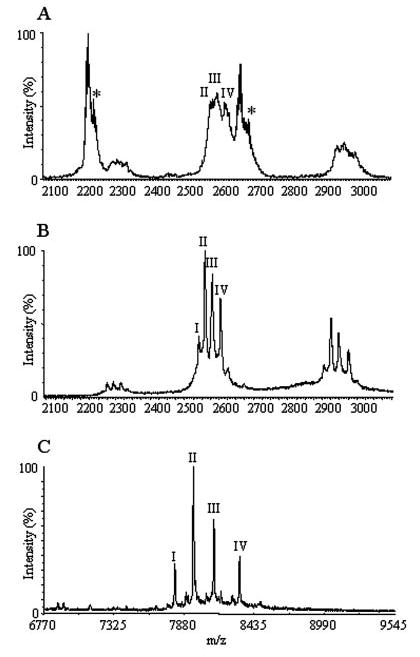
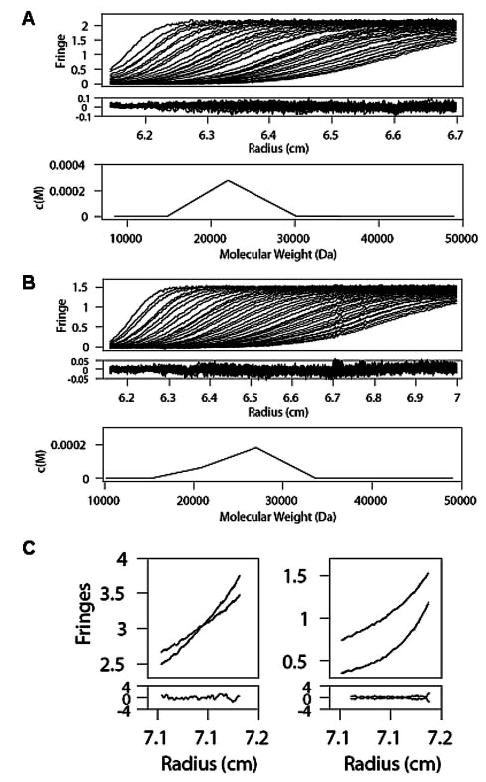
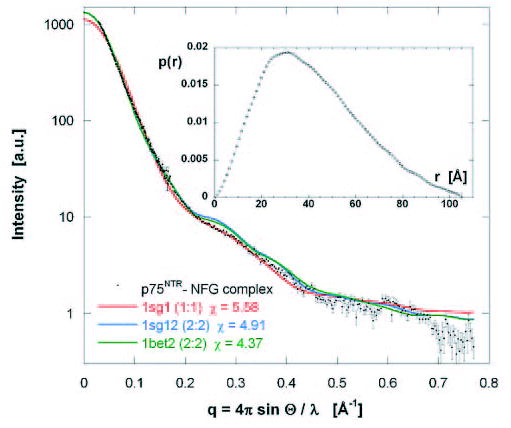
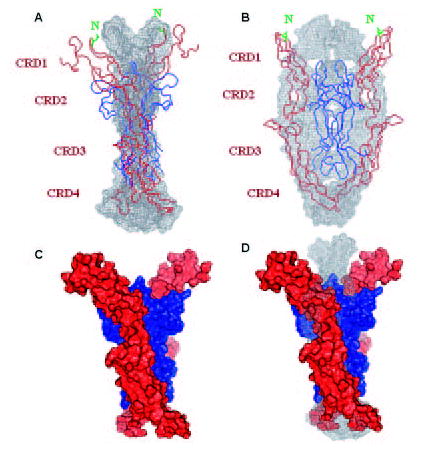
Nerve growth factor (NGF) is the ligand for two unrelated cellular receptors, TrkA and p75(NTR), and acts as a mediator in the development and maintenance of the mammalian nervous system. Signaling through TrkA kinase domains promotes neuronal survival, whereas activation of the p75(NTR) "death domains" induces apoptosis under correct physiological conditions. However, co-expression of these receptors leads to enhanced neuronal survival upon NGF stimulation, possibly through a ternary p75(NTR) x NGF x TrkA complex. We have expressed human p75(NTR) ligand binding domain as a secreted glycosylated protein in Trichoplusia ni cells. Following assembly and purification of soluble p75(NTR) x NGF complexes, mass spectrometry, analytical ultracentrifugation, and solution x-ray scattering measurements are indicative of 2:2 stoichiometry, which implies a symmetric complex. Molecular models of the 2:2 p75(NTR) x NGF complex based on these data are not consistent with the further assembly of either symmetric (2:2:2) or asymmetric (2:2:1) ternary p75(NTR) x NGF x TrkA complexes.
Figures
Similar articles
-
Differential activity of the nerve growth factor (NGF) antagonist PD90780 [7-(benzolylamino)-4,9-dihydro-4-methyl-9-oxo-pyrazolo[5,1-b]quinazoline-2-carboxylic acid] suggests altered NGF-p75NTR interactions in the presence of TrkA.J Pharmacol Exp Ther. 2004 Aug;310(2):505-11. doi: 10.1124/jpet.104.066225. Epub 2004 Mar 29. J Pharmacol Exp Ther. 2004. PMID: 15051797
-
NGF ligand alters NGF signaling via p75(NTR) and trkA.J Neurosci Res. 2000 Aug 1;61(3):263-72. doi: 10.1002/1097-4547(20000801)61:3<263::AID-JNR4>3.0.CO;2-M. J Neurosci Res. 2000. PMID: 10900073
-
Structure of nerve growth factor complexed with the shared neurotrophin receptor p75.Science. 2004 May 7;304(5672):870-5. doi: 10.1126/science.1095190. Science. 2004. PMID: 15131306
-
High affinity not in the vicinity?Neuron. 2007 Jan 4;53(1):1-4. doi: 10.1016/j.neuron.2006.12.018. Neuron. 2007. PMID: 17196523 Review.
-
Structural Characterization of the p75 Neurotrophin Receptor: A Stranger in the TNFR Superfamily.Vitam Horm. 2017;104:57-87. doi: 10.1016/bs.vh.2016.10.007. Epub 2016 Nov 29. Vitam Horm. 2017. PMID: 28215307 Review.
Cited by
-
The effects of transmembrane sequence and dimerization on cleavage of the p75 neurotrophin receptor by γ-secretase.J Biol Chem. 2012 Dec 21;287(52):43810-24. doi: 10.1074/jbc.M112.382903. Epub 2012 Oct 26. J Biol Chem. 2012. PMID: 23105112 Free PMC article.
-
Molecular and structural insight into proNGF engagement of p75NTR and sortilin.J Mol Biol. 2010 Mar 5;396(4):967-84. doi: 10.1016/j.jmb.2009.12.030. Epub 2009 Dec 28. J Mol Biol. 2010. PMID: 20036257 Free PMC article.
-
An intracellular domain fragment of the p75 neurotrophin receptor (p75(NTR)) enhances tropomyosin receptor kinase A (TrkA) receptor function.J Biol Chem. 2013 Apr 19;288(16):11144-54. doi: 10.1074/jbc.M112.436469. Epub 2013 Mar 7. J Biol Chem. 2013. PMID: 23471969 Free PMC article.
-
Structural Basis of p75 Transmembrane Domain Dimerization.J Biol Chem. 2016 Jun 3;291(23):12346-57. doi: 10.1074/jbc.M116.723585. Epub 2016 Apr 7. J Biol Chem. 2016. PMID: 27056327 Free PMC article.
-
Death Domain Signaling by Disulfide-Linked Dimers of the p75 Neurotrophin Receptor Mediates Neuronal Death in the CNS.J Neurosci. 2016 May 18;36(20):5587-95. doi: 10.1523/JNEUROSCI.4536-15.2016. J Neurosci. 2016. PMID: 27194337 Free PMC article.
References
-
- Ibanez C. Trends Neurosci. 2002;25:284–286. - PubMed
-
- Shooter E. Annu Rev Neurosci. 2001;24:601–629. - PubMed
-
- McDonald N, Lapatto R, Murray-Rust J, Gunning J, Wlodawer A, Blundell T. Nature. 1991;354:411–414. - PubMed
-
- Huang EJ, Reichardt LF. Annu Rev Biochem. 2003;72:609–642. - PubMed
-
- Bothwell M. Annu Rev Neurosci. 1995;18:223–253. - PubMed
Publication types
MeSH terms
Substances
Grants and funding
LinkOut - more resources
Full Text Sources
Research Materials
