. 2005 Jul 18;170(2):201-11.
doi: 10.1083/jcb.200503043. Epub 2005 Jul 11.

Dynamic assembly and sustained retention of 53BP1 at the sites of DNA damage are controlled by Mdc1/NFBD1

Affiliations

Dynamic assembly and sustained retention of 53BP1 at the sites of DNA damage are controlled by Mdc1/NFBD1

Simon Bekker-Jensen et al. J Cell Biol. .

Abstract

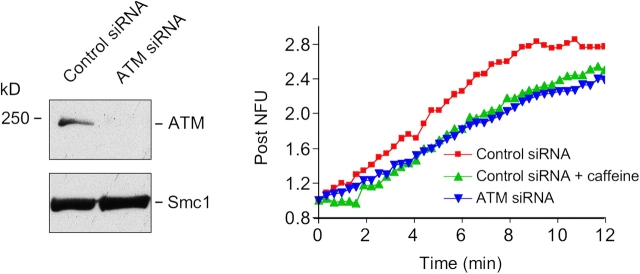
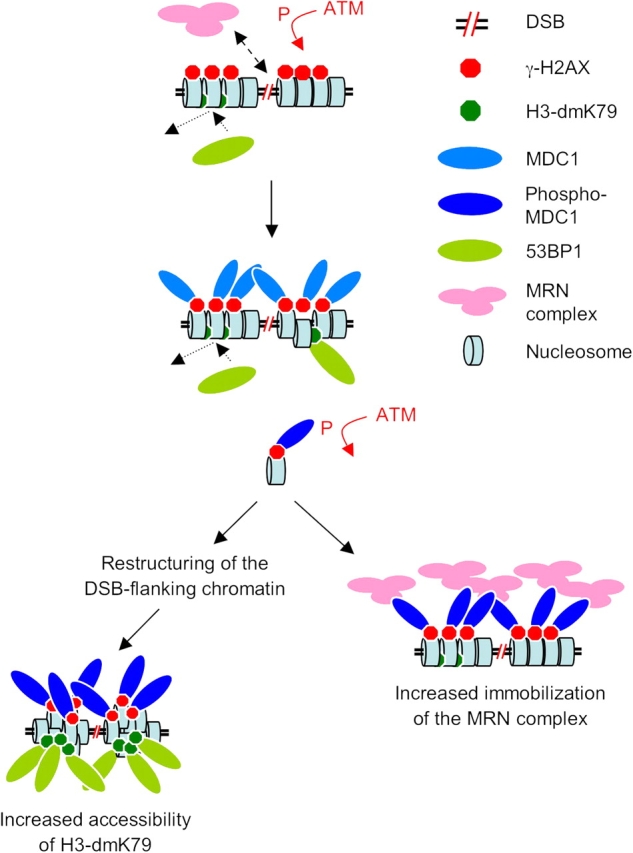
53BP1 is a key component of the genome surveillance network activated by DNA double strand breaks (DSBs). Despite its known accumulation at the DSB sites, the spatiotemporal aspects of 53BP1 interaction with DSBs and the role of other DSB regulators in this process remain unclear. Here, we used real-time microscopy to study the DSB-induced redistribution of 53BP1 in living cells. We show that within minutes after DNA damage, 53BP1 becomes progressively, yet transiently, immobilized around the DSB-flanking chromatin. Quantitative imaging of single cells revealed that the assembly of 53BP1 at DSBs significantly lagged behind Mdc1/NFBD1, another DSB-interacting checkpoint mediator. Furthermore, short interfering RNA-mediated ablation of Mdc1/NFBD1 drastically impaired 53BP1 redistribution to DSBs and triggered premature dissociation of 53BP1 from these regions. Collectively, these in vivo measurements identify Mdc1/NFBD1 as a key upstream determinant of 53BP1's interaction with DSBs from its dynamic assembly at the DSB sites through sustained retention within the DSB-flanking chromatin up to the recovery from the checkpoint.


Figures

Figure 1.
Figure 1.
Characterization of the cellular model to study 53BP1 dynamics in vivo. (A) Lysates from naive U-2-OS cells and M1 cell line stably expressing murine GFP-53BP1 (25 μg of total protein per lane) were analyzed by immunoblotting with antibodies to GFP (left) and 53BP1 (right). (B) A snapshot of a live, exponentially growing M1 cell line showing nuclear localization of GFP-53BP1 and its accumulation in distinct nuclear speckles in a subset of cells. (C) Naive, asynchronously growing U-2-OS cells were fixed and immunostained with an antibody to endogenous (endo) 53BP1. (D) Exponentially growing M1 cells were immunostained as in C. Note that the accumulation of the endogenous 53BP1 in the nuclear speckles tightly correlates with decoration of these subnuclear compartments with the GFP-tagged protein (in several hundred M1 cells examined by this approach, we never detected a nuclear speckle with endogenous 53BP1 that would not contain also the increased GFP signal). Bars, 10 μm.
Figure 2.
Figure 2.
Dynamic assembly of 53BP1 at the DSB sites. (A) M1 cells were subjected to laser microirradiation followed by the real-time recording of the GFP-53BP1 assembly kinetics. Dotted arrow in the first image frame indicates the laser paths across the cell nuclei. (B) The M1 cells were assayed as in A, and the fluorescence intensity values reflecting the progressive accumulation of GFP-53BP1 at the DSB sites were recorded, pooled from 10 independent experiments, and fitted to the solutions of linear differential equations of increasing order. NFU, normalized fluorescence units. (C) A summary of the FRAP analysis integrated from 10 independent measurements at the DSB tracks and in undamaged nuclei. Error bars represent twice the SD. (D) Cell lines expressing wild-type (M1) and the Tudor-deficient (Y1487L) forms of GFP-53BP1 were subjected to laser microirradiation as in A. The fold increase in GFP-associated fluorescence along the DSB tracks was calculated and plotted as a function of time. The displayed assembly curves were generated after integrating data from 10 independent experiments for each 53BP1 variant. (E) Undamaged nuclei of M1 and Y1487L cell lines were subjected to FRAP analysis as in C. Note that the recovery profiles are significantly different (compare also the τ values in Table I). Bar, 10 μm.
Figure 3.
Figure 3.
53BP1 assembly at the DSB sites is delayed compared with that of Mdc1. (A) U-2-OS cells stably expressing GFP-Mdc1 were labeled with a cytosolic cell tracker (see the extranuclear red fluorescence) and mixed with the GFP-53BP1–expressing cell line. After 24 h, these mixed cell cultures were subjected to laser microirradiation followed by the real-time recording of the GFP-53BP1 and/or GFP-Mdc1 assembly kinetics (dotted arrow indicates the laser paths across the cell nuclei). (B) The kinetic assembly profiles of GFP-Mdc1 and GFP-53BP1 derived from 10 independent experiments (compare also the ω values in Table I). (C) Naive, asynchronously growing U-2-OS cells were plated on grid glass coverslips and microirradiated along a narrow linear region. The exact time of microirradiation was recorded for each individual cell. Immediately after the microirradiation of the last cell, the entire cell population was fixed and coimmunostained with antibodies to Mdc1 (top) and 53BP1 (bottom). The microirradiated regions were retrieved via the coverslip grid and analyzed for the cytologically discernible accumulation of the endogenous proteins in the DSB-containing nuclear tracks. The arrowheads in A and C indicate the time points of the first cytologically detectable accumulation of each protein. Error bars equal twice the SD of the normalized data at the respective time points. Bars, 10 μm.
Figure 4.
Figure 4.
Impaired assembly of 53BP1 at the DSB sites in the absence of Mdc1. (A) Lysates from M1 cells transfected with control- or Mdc1-directed siRNA duplexes for 72 h were analyzed by immunoblotting with the indicated antibodies (left). In parallel, the siRNA-treated cells were microirradiated and subject to the real-time assembly measurement of GFP-53BP1 as in Fig. 2 A (right). The fold increase in GFP-associated fluorescence along the DSB tracks was calculated and displayed as in Fig. 3 B. (B) A snapshot of live M1 cells treated with the indicated siRNA duplexes as in A and recorded 15 min after laser microirradiation. Note the reduced intensity of the GFP-53BP1–associated fluorescence at the DSB areas in Mdc1-depleted cells. (C) Lysates from a GFP-Mdc1–expressing cell line transfected with control- or 53BP1-directed siRNA duplexes were analyzed by immunoblotting with the indicated antibodies (left). 72 h after siRNA transfections, the cells were microirradiated and subjected to the real-time assembly measurement of GFP-Mdc1 (right). Smc1 immunoblots in A and C serve as loading controls. All kinetic experiments in this figure were derived from three independent experiments with 10 cells evaluated for each condition. Error bars equal twice the SD of the normalized data at the respective time points. Bars, 10 μm.
Figure 5.
Figure 5.
Inhibition of the ATM kinase recapitulates the impact of Mdc1 down-regulation on the 53BP1 assembly at the DSB sites. M1 cells were treated with control or ATM-targeting siRNA duplexes for 72 h and analyzed by immunoblotting for the efficiency of ATM down-regulation (left; Smc1 immunoblot serves as a loading control). In parallel, the siRNA-treated cells were subject to local laser microirradiation followed by the real-time recording of the GFP-53BP1 assembly kinetics (right). Where indicated, caffeine (10 mM) was added to the culture media immediately before microirradiation.
Figure 6.
Figure 6.
53BP1 undergoes premature dissociation from the DSB sites in the absence of MDC1. (A) M1 cells were microirradiated as described in Fig. 2 A and subject to an extended time-lapse recording. Red arrows trace a cell where GFP-53BP1 progressively dissociated from the DSB tracks and which then underwent a complete mitosis. (B) M1 cells were treated with control- and Mdc1-directed siRNA for 72 h, microirradiated, and subject to the extended time-lapse analyses as in A. The disassembly rate of GFP-53BP1 from the DSB tracks was assessed by recording the time when the GFP-associated fluorescence in the DSB areas equilibrated with that in the undamaged parts of the same nucleus. (C) M1cells were treated with the indicated siRNAs and microirradiated with the low and high laser energy output to generate an increasing amount of DNA damage (see Materials and methods). 4 h after microirradiation, the cells were fixed and immunostained with an antibody to γ-H2AX. Note that the Mdc1 depletion drastically impaired GFP-53BP1 interaction with the DSB sites at the time when focal accumulation of γ-H2AX remained clearly discernible in these regions. Bars, 10 μm.
Figure 7.
Figure 7.
Model of the spatiotemporal organization of the chromosomal microcompartments surrounding the DSB sites. DSB detection by the MRN complex is followed by the recruitment of active ATM and phosphorylation of H2AX in the DSB-flanking chromatin. At this stage, H3-dmK79 remains poorly accessible and allows only a very transient 53BP1–chromatin interaction (top). Generation of γ-H2AX triggers assembly of Mdc1. The physical changes in the DSB-surrounding chromatin also initiate accumulation of 53BP1 by an increased exposure of a limited number of H3-dmK79 residues. However, this interaction is relatively inefficient and manifests by a temporal delay of 53BP1 assembly compared with that of Mdc1 (middle). Continuing accumulation of γ-H2AX–Mdc1 complexes in the DSB regions followed by ATM-dependent phosphorylation of Mdc1 triggers the full-scale assembly of 53BP1. This may be achieved either by promoting further structural rearrangements of the DSB-surrounding chromatin compatible with an increased exposure of interaction-competent H3-dmK79 residues (bottom, left) or by stabilization of the 53BP1-H3-dmK79 binding. In parallel, accumulation of ATM-phosphorylated Mdc1 in the vicinity of the DNA lesions stabilizes the interaction of the MRN complex with these regions via direct protein–protein interaction (bottom, right; see Discussion).

References

    1. Anderson, L., C. Henderson, and Y. Adachi. 2001. Phosphorylation and rapid relocalization of 53BP1 to nuclear foci upon DNA damage. Mol. Cell. Biol. 21:1719–1729. - PMC - PubMed
    1. Celeste, A., O. Fernandez-Capetillo, M.J. Kruhlak, D.R. Pilch, D.W. Staudt, A. Lee, R.F. Bonner, W.M. Bonner, and A. Nussenzweig. 2003. Histone H2AX phosphorylation is dispensable for the initial recognition of DNA breaks. Nat. Cell Biol. 5:675–679. - PubMed
    1. D'Amours, D., and S.P. Jackson. 2002. The Mre11 complex: at the crossroads of DNA repair and checkpoint signalling. Nat. Rev. Mol. Cell Biol. 3:317–327. - PubMed
    1. DiTullio, R.A., Jr., T.A. Mochan, M. Venere, J. Bartkova, M. Sehested, J. Bartek, and T.D. Halazonetis. 2002. 53BP1 functions in an ATM-dependent checkpoint pathway that is constitutively activated in human cancer. Nat. Cell Biol. 4:998–1002. - PubMed
    1. Downs, J.A., S. Allard, O. Jobin-Robitaille, A. Javaheri, A. Auger, N. Bouchard, S.J. Kron, S.P. Jackson, and J. Cote. 2004. Binding of chromatin-modifying activities to phosphorylated histone H2A at DNA damage sites. Mol. Cell. 16:979–990. - PubMed

Publication types

MeSH terms