. 2005 Aug 2;102(31):10993-8.
doi: 10.1073/pnas.0503291102. Epub 2005 Jul 11.

Aquaporin 7 deficiency is associated with development of obesity through activation of adipose glycerol kinase

Affiliations

Aquaporin 7 deficiency is associated with development of obesity through activation of adipose glycerol kinase

Toshiyuki Hibuse et al. Proc Natl Acad Sci U S A. .

Abstract

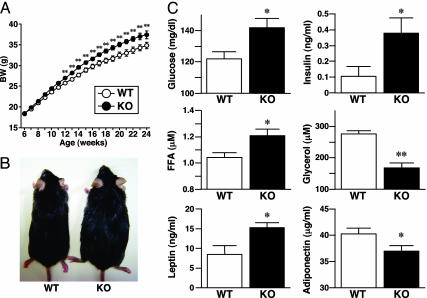
In adipocytes, hydrolysis of triglycerides results in the release of free fatty acids and glycerol. Aquaporin 7 (AQP7), a member of aquaglyceroporins, is known to permeabilize glycerol and water. We recently generated Aqp7-knockout (KO) mice and demonstrated that such mice have low plasma glycerol levels and impaired glycerol release in response to beta3-adrenergic agonist, suggesting that AQP7 acts as a glycerol gateway molecule in adipocytes for the efficient release of glycerol in vivo. Although there was no difference in body weight between WT and KO mice until 10 weeks of age, here we found that KO mice developed adult-onset obesity. The body weight and fat mass increased significantly in KO mice compared with WT mice after 12 weeks of age. Adipocytes of KO mice were large and exhibited accumulation of triglycerides compared with WT mice. The KO mice developed obesity and insulin resistance even at a young age after consumption of high-fat/high-sucrose diet. We demonstrated the enhanced glycerol kinase enzymatic activity in Aqp7-KO and -knockdown adipocytes. A series of our results indicate that AQP7 disruption elevates adipose glycerol kinase activity, accelerates triglycerides synthesis in adipocytes, and, finally, develops obesity.


Figures

Fig. 1.
Fig. 1.
Growth and metabolic parameters of KO mice under normal chow diet. (A) Growth curves of WT (n = 55) and KO (n = 62) mice. (B) Appearance of 20-week-old mice. (C) Metabolic parameters of 20-week-old mice under a 12-h fasting state (WT, n = 8; KO, n = 7). In A and C, data are mean ± SEM. *, P < 0.05; **, P < 0.01; compared with the values of WT mice under the same conditions.
Fig. 2.
Fig. 2.
Adipocyte hypertrophy in KO mice. Adipose tissues were excised from WT and KO mice at 20 weeks of age. (A) Appearance of epididymal (Upper) and retroperitoneal (Lower) fat. The top images show the ventral view of WT and KO mice. The bottom images indicate fat pads with testis and kidney, respectively. (B) Weights of various adipose tissues (n = 6 per group). (C) Histology of epididymal WAT. WAT sections were stained by hematoxylin and eosin after formalin fixation. (D) Cell size distribution of adipocytes in WT (Upper) and KO (Lower) mice. The area of white adipocyte was measured in 200 or more cells per mouse in the respective groups. (E) DNA content in WAT (n = 6 per group). (F) Triglyceride content in WAT (n = 6 per group). Epi, epididymal WAT; Ret, retroperitoneal WAT; Sub, s.c. WAT; TG, triglyceride. In B, E, and F, data are mean ± SEM. *, P < 0.05; **, P < 0.01; compared with the values of WT mice.
Fig. 3.
Fig. 3.
Whole-body insulin resistance associated with obesity in KO mice. Mice were examined at 20 weeks of age. (A) Glucose curves under insulin tolerance test (n = 8 per group). Plasma glucose concentrations were normalized to those at 0 min (100%). (B) Glucose curves from a glucose tolerance test (n = 8 per group). (C and D) Insulin-stimulated IRS-1-associated (C) and IRS-2-associated (D) PI3-kinase activity (n = 5 per group). 32P-labeled 3-phosphatidylinositides were quantified as described in Materials and Methods. (E) Insulin-stimulated phosphorylation of Akt (n = 5 per group). Equal amounts of protein were immunoblotted with anti-phospho-Akt and anti-Akt antibodies. Phosphorylated-Akt and Akt signal was quantified by a scanning imager. The relative ratio of Akt phosphorylation was calculated after normalization with Akt signal and normalized in WT mice without insulin in respective tissues. WAT, epididymal white adipose tissue. Data are mean ± SEM. *, P < 0.05; **, P < 0.01; compared with WT mice under same condition.
Fig. 4.
Fig. 4.
Diet-induced obesity in KO mice. (A) The protocol of HF/HS diet study. Mice were started on HF/HS diet at 8 weeks of age, when there were no differences in body weight between WT (n = 5) and KO (n = 8) mice. (B-D) Shown is the effect of HF/HS diet on body weight (B), plasma glucose (C), and plasma insulin (D). (E) Glucose curves under the insulin tolerance test after 4 weeks HF/HS diet. Plasma glucose concentrations were normalized to those at 0 min (100%). (F) Glucose curves from the glucose tolerance test. In B, D, E, and F, data are mean ± SEM. *, P < 0.05; **, P < 0.01; compared with the values of WT mice under the same conditions.
Fig. 5.
Fig. 5.
Physiological and molecular analysis of metabolic function. (A) O2 consumption in WT and KO mice at 10 weeks of age (n = 4 per group). (B) Rectal temperature at 6-10 weeks of age (WT, n = 90; KO, n = 57), 12-19 weeks of age (WT, n = 29; KO, n = 29), and 20-24 weeks of age (WT, n = 19; KO, n = 25). (C) Northern blot analysis of mRNAs of Ucp, uncoupling protein; Cd36, CD36 antigen; Slc27a1, solute carrier family 27 (fatty acid transporter), member 1; Lpl, lipoprotein lipase; Irs, insulin receptor substrate; Dgat, diacylglycerol O-acyltransferase; Plin, perilipin; Lipe, lipase, hormone sensitive; Adipoq, adiponectin, C1Q, and collagen domain containing; Lep, leptin; Fabp4, fatty acid binding protein 4, adipocyte; Pparg, peroxisome proliferator-activated receptor γ; Cebpa, CCAAT/enhancer binding protein (C/EBP) α; Arbp, acidic ribosomal phosphoprotein P0 (36B4) in WAT (white adipose tissue) and BAT (brown adipose tissue). In A and B, data are mean ± SEM. **, P < 0.01 compared with WT mice.
Fig. 6.
Fig. 6.
Enhanced adipose glycerol kinase enzymatic activity in Aqp7-KO and -knockdown adipocytes. (A) Gyk enzymatic activity in WAT of WT and KO mice under 12-h fasting condition (n = 6 per group). (B and C) Glycerol concentrations in media (B) and glycerol contents in cell lysates (C) of Aqp7-knockdown 3T3-L1 adipocytes (n = 6 per group). (D) Gyk enzymatic activity in 3T3-L1 adipocytes transfected with RNAi. Shown are folds of induction calculated based on the activity from transfections with control RNAi (n = 6 per group). (E) Uptake of oleic acid in 3T3-L1 adipocytes transfected with RNAi (n = 6 per group). (F) Intracellular triglyceride (TG) contents in RNAi-transfected 3T3-L1 adipocytes (n = 6 per group). (G) Schematic presentation of the mechanism of obesity in Aqp7 KO mice. AQP7 ensures efficient glycerol release from adipocytes in WT mice (Upper). Adipose AQP7 deficiency is associated with an increase of intracellular glycerol content. The latter enhances Gyk enzymatic activity converting glycerol to glycerol-3-P, promotes uptake of fatty acids, and finally results in TG accumulation in AQP7-deficient adipocytes (Lower). FFA, free fatty acid. In A-F, data are mean ± SEM. *, P < 0.05; **, P < 0.01; compared with WT mice or control RNAi.

Comment in

References

    1. Denker, B. M., Smith, B. L., Kuhajda, F. P. & Agre, P. (1988) J. Biol. Chem. 263, 15634-15642. - PubMed
    1. Verkman, A. S. (2002) J. Anat. 200, 617-627. - PMC - PubMed
    1. Agre, P. & Kozono, D. (2003) FEBS Lett. 555, 72-78. - PubMed
    1. Preston, G. M., Carroll, T. P., Guggino, W. B. & Agre, P. (1992) Science 256, 385-387. - PubMed
    1. Giles, J. (2003) Nature 425, 651. - PubMed

Publication types

MeSH terms