

KaPPA-view: a web-based analysis tool for integration of transcript and metabolite data on plant metabolic pathway maps
- PMID: 16010003
- PMCID: PMC1176402
- DOI: 10.1104/pp.105.060525
KaPPA-view: a web-based analysis tool for integration of transcript and metabolite data on plant metabolic pathway maps
Abstract
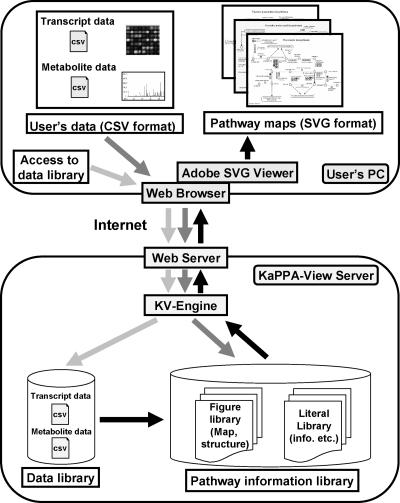
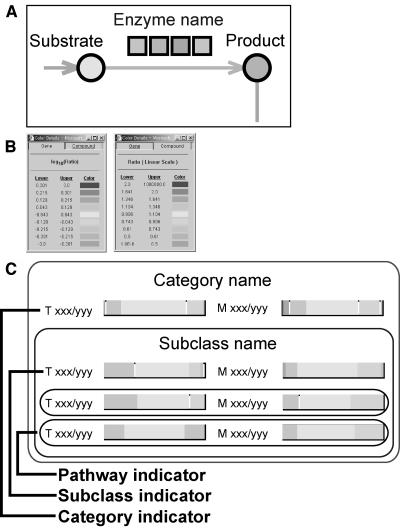
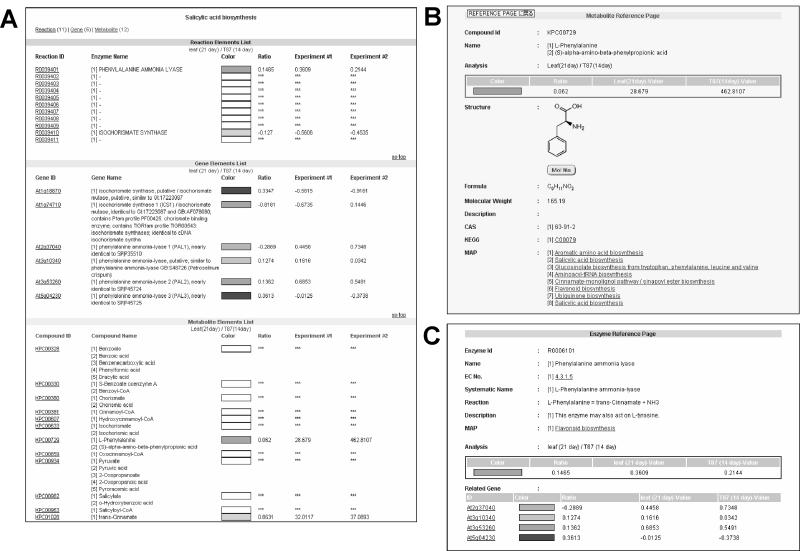
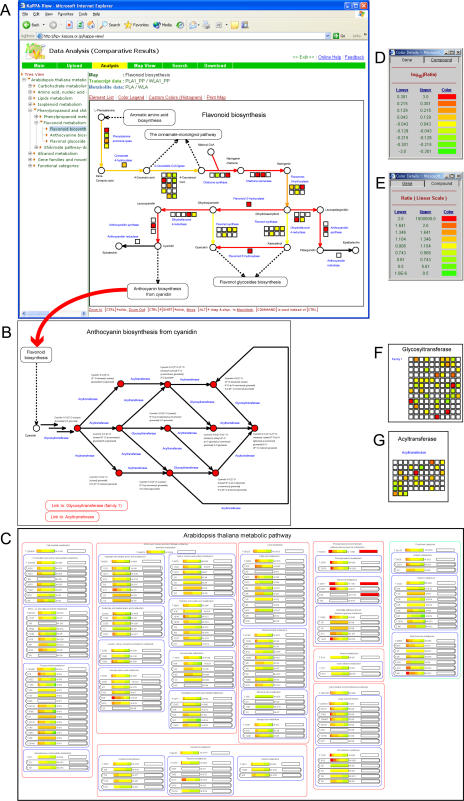
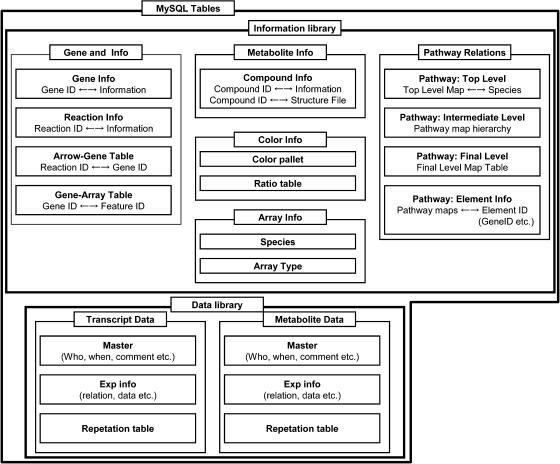
The application of DNA array technology and chromatographic separation techniques coupled with mass spectrometry to transcriptomic and metabolomic analyses in plants has resulted in the generation of considerable quantitative data related to transcription and metabolism. The integration of "omic" data is one of the major concerns associated with research into identifying gene function. Thus, we developed a Web-based tool, KaPPA-View, for representing quantitative data for individual transcripts and/or metabolites on plant metabolic pathway maps. We prepared a set of comprehensive metabolic pathway maps for Arabidopsis (Arabidopsis thaliana) and depicted these graphically in Scalable Vector Graphics format. Individual transcripts assigned to a reaction are represented symbolically together with the symbols of the reaction and metabolites on metabolic pathway maps. Using quantitative values for transcripts and/or metabolites submitted by the user as Comma Separated Value-formatted text through the Internet, the KaPPA-View server inserts colored symbols corresponding to a defined metabolic process at that site on the maps and returns them to the user's browser. The server also provides information on transcripts and metabolites in pop-up windows. To demonstrate the process, we describe the dataset obtained for transgenic plants that overexpress the PAP1 gene encoding a MYB transcription factor on metabolic pathway maps. The presentation of data in this manner is useful for viewing metabolic data in a way that facilitates the discussion of gene function.
Figures
References
-
- Aharoni A, Ric de Vos CH, Verhoeven HA, Maliepaard CA, Kruppa G, Bino R, Goddenowe DB (2002) Nontargeted metabolome analysis by use of Fourier Transform Ion Cyclotron Mass Spectrometry. OMICS 6: 217–234 - PubMed
-
- Aharoni A, Vorst O (2002) DNA microarrays for functional plant genomics. Plant Mol Biol 48: 99–118 - PubMed
-
- Arabidopsis Genome Initiative (2000) Analysis of the genome sequence of the flowering plant Arabidopsis thaliana. Nature 408: 796–815 - PubMed
-
- Beisson F, Koo AJ, Ruuska S, Schwender J, Pollard M, Thelen JJ, Paddock T, Salas JJ, Savage L, Milcamps A, et al (2003) Arabidopsis genes involved in acyl lipid metabolism. A 2003 census of the candidates, a study of the distribution of expressed sequence tags in organs, and a Web-based database. Plant Physiol 132: 681–697 - PMC - PubMed
-
- Bloor SJ, Abrahams S (2002) The structure of the major anthocyanin in Arabidopsis thaliana. Phytochemistry 59: 343–346 - PubMed
Publication types
MeSH terms
Substances
LinkOut - more resources
Full Text Sources
Molecular Biology Databases
