

CD4+ CD25+ FOXP3+ regulatory T cells from human thymus and cord blood suppress antigen-specific T cell responses
- PMID: 16011520
- PMCID: PMC1782183
- DOI: 10.1111/j.1365-2567.2005.02186.x
CD4+ CD25+ FOXP3+ regulatory T cells from human thymus and cord blood suppress antigen-specific T cell responses
Abstract
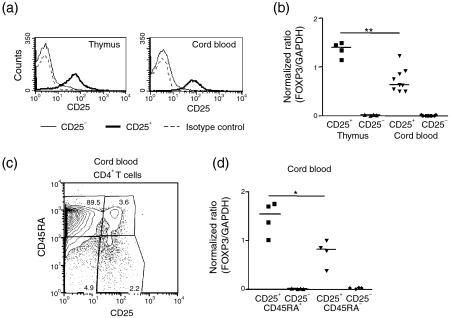
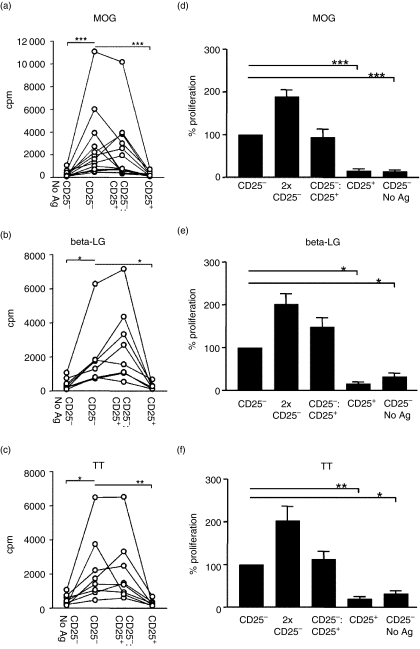
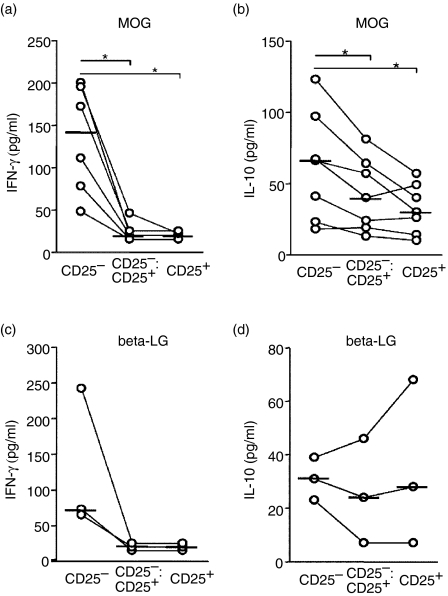
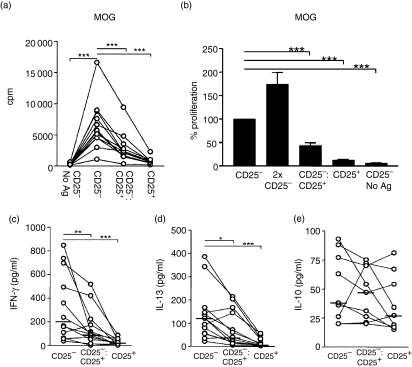
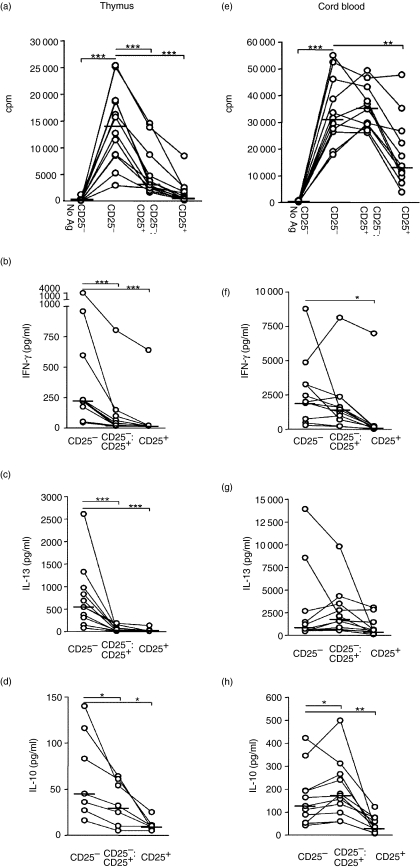
Activation of self-reactive T cells in healthy adults is prevented by the presence of autoantigen-specific CD4+CD25+ regulatory T cells (CD25+ Treg). To explore the functional development of autoantigen-reactive CD25+ Treg in humans we investigated if thymic CD25+ Treg from children aged 2 months to 11 years and cord blood CD25+ Treg are able to suppress proliferation and cytokine production induced by specific antigens. While CD4+CD25- thymocytes proliferated in response to myelin oligodendrocyte glycoprotein (MOG), tetanus toxoid and beta-lactoglobulin, suppression of proliferation was not detected after the addition of thymic CD25+ Treg. However, CD25+ Treg inhibited interferon (IFN)-gamma production induced by MOG, which indicates that MOG-reactive CD25+ Treg are present in the thymus. In contrast, cord blood CD25+ Treg suppressed both proliferation and cytokine production induced by MOG. Both cord blood and thymic CD25+ Treg expressed FOXP3 mRNA. However, FOXP3 expression was lower in cord blood than in thymic CD25+ T cells. Further characterization of cord blood CD25+ T cells revealed that FOXP3 was highly expressed by CD25+CD45RA+ cells while CD25+CD45RA- cells contained twofold less FOXP3, which may explain the lower expression level of FOXP3 in cord blood CD25+ T cells compared to thymic CD25+ T cells. In conclusion, our data demonstrate that low numbers of MOG-reactive functional CD25+ Treg are present in normal thymus, but that the suppressive ability of the cells is broader in cord blood. This suggests that the CD25+ Treg may be further matured in the periphery after being exported from the thymus.
Figures
Similar articles
-
CD4 T cell activation by myelin oligodendrocyte glycoprotein is suppressed by adult but not cord blood CD25+ T cells.Eur J Immunol. 2003 Mar;33(3):579-87. doi: 10.1002/eji.200323701. Eur J Immunol. 2003. PMID: 12616478
-
Comparative study of regulatory T cell function of human CD25CD4 T cells from thymocytes, cord blood, and adult peripheral blood.Clin Dev Immunol. 2008;2008:305859. doi: 10.1155/2008/305859. Clin Dev Immunol. 2008. PMID: 18815628 Free PMC article.
-
CD25+CD4+ T cells in human cord blood: an immunoregulatory subset with naive phenotype and specific expression of forkhead box p3 (Foxp3) gene.Exp Hematol. 2004 Jul;32(7):622-9. doi: 10.1016/j.exphem.2004.03.012. Exp Hematol. 2004. PMID: 15246158
-
Thymic regulatory T cells.Autoimmun Rev. 2005 Nov;4(8):579-86. doi: 10.1016/j.autrev.2005.04.010. Autoimmun Rev. 2005. PMID: 16214099 Review.
-
Thymic commitment of regulatory T cells is a pathway of TCR-dependent selection that isolates repertoires undergoing positive or negative selection.Curr Top Microbiol Immunol. 2005;293:43-71. doi: 10.1007/3-540-27702-1_3. Curr Top Microbiol Immunol. 2005. PMID: 15981475 Review.
Cited by
-
Higher proportions of circulating FOXP3+ and CTLA-4+ regulatory T cells are associated with lower fractions of memory CD4+ T cells in infants.J Leukoc Biol. 2011 Dec;90(6):1133-40. doi: 10.1189/jlb.0511244. Epub 2011 Sep 20. J Leukoc Biol. 2011. PMID: 21934066 Free PMC article.
-
Staphylococcus aureus convert neonatal conventional CD4(+) T cells into FOXP3(+) CD25(+) CD127(low) T cells via the PD-1/PD-L1 axis.Immunology. 2014 Mar;141(3):467-81. doi: 10.1111/imm.12209. Immunology. 2014. PMID: 24708420 Free PMC article.
-
Harnessing antitumor immunity: Employment of tumor recall antigens to optimize the inflammatory response to cancer.Oncol Lett. 2017 Apr;13(4):2015-2020. doi: 10.3892/ol.2017.5721. Epub 2017 Feb 13. Oncol Lett. 2017. PMID: 28454356 Free PMC article.
-
Immunobiology of Gestational Diabetes Mellitus in Post-Medawar Era.Front Immunol. 2022 Jan 3;12:758267. doi: 10.3389/fimmu.2021.758267. eCollection 2021. Front Immunol. 2022. PMID: 35046934 Free PMC article. Review.
-
Unlocking the therapeutic potential of thymus-isolated regulatory T cells.Front Immunol. 2025 Jun 26;16:1612360. doi: 10.3389/fimmu.2025.1612360. eCollection 2025. Front Immunol. 2025. PMID: 40642063 Free PMC article. Review.
References
-
- Suri-Payer E, Amar AZ, Thornton AM, Shevach EM. CD4+CD25+ T cells inhibit both the induction and effector function of autoreactive T cells and represent a unique lineage of immunoregulatory cells. J Immunol. 1998;160:1212–8. - PubMed
-
- Hori S, Sakaguchi S. Foxp3: a critical regulator of the development and function of regulatory T cells. Microbes Infect. 2004;6:745–51. - PubMed
-
- Wing K, Lindgren S, Kollberg G, Lundgren A, Harris RA, Rudin A, Lundin S, Suri-Payer E. CD4 T cell activation by myelin oligodendrocyte glycoprotein is suppressed by adult but not cord blood CD25+ T cells. Eur J Immunol. 2003;33:579–87. - PubMed
-
- Cosmi L, Liotta F, Lazzeri E, et al. Human CD8+CD25+ thymocytes share phenotypic and functional features with CD4+CD25+ regulatory thymocytes. Blood. 2003;102:4107–14. - PubMed
-
- Yagi H, Nomura T, Nakamura K, et al. Crucial role of FOXP3 in the development and function of human CD25+CD4+ regulatory T cells. Int Immunol. 2004;16:1643–56. - PubMed
Publication types
MeSH terms
Substances
LinkOut - more resources
Full Text Sources
Other Literature Sources
Medical
Research Materials
