. 2005 Jul;129(1):285-302.
doi: 10.1053/j.gastro.2005.04.013.

Epidermal growth factor receptor: a novel target of the Wnt/beta-catenin pathway in liver

Affiliations

Epidermal growth factor receptor: a novel target of the Wnt/beta-catenin pathway in liver

Xinping Tan et al. Gastroenterology. 2005 Jul.

Abstract

Background & aims: Wnt/beta-catenin activation is observed in normal liver development, regeneration, and liver cancer. Our aim was to elucidate the regulation and mechanism of this pathway in liver.

Methods: We report the generation and characterization of liver-specific nonmutated beta-catenin-overexpressing transgenic mice. Transgenic livers were examined for their morphology and phenotype by histology, proliferation, apoptosis, and microarray analysis.

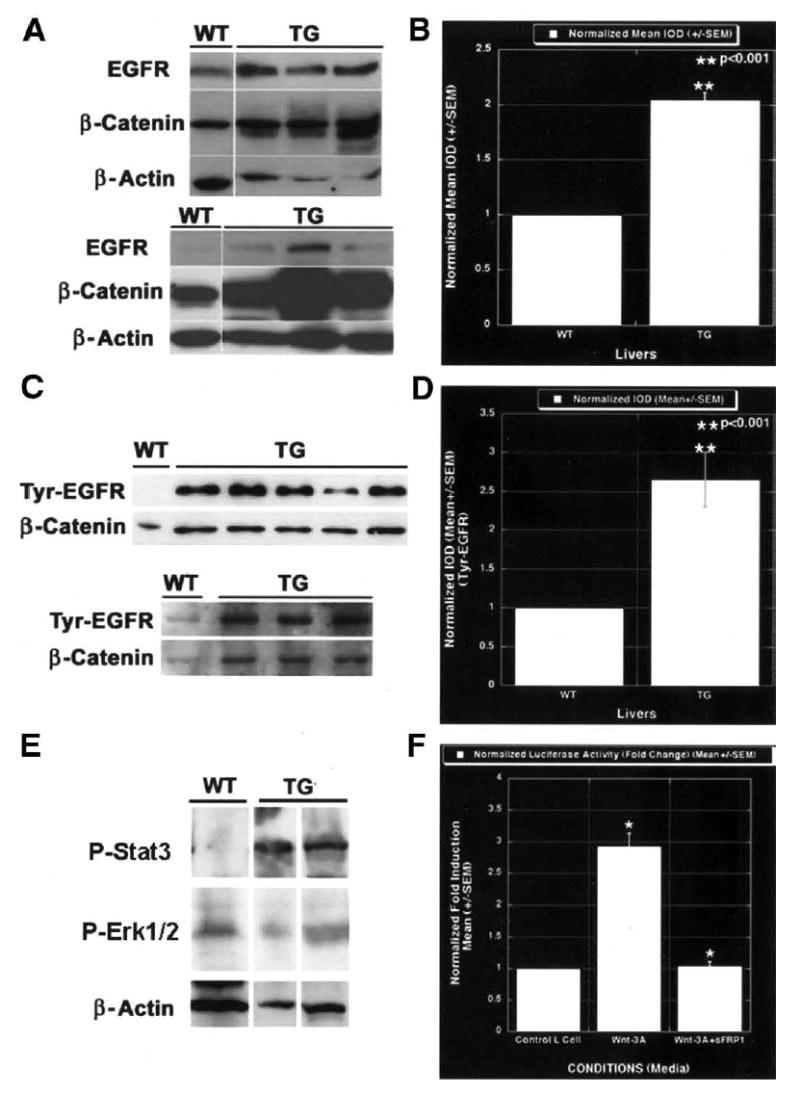
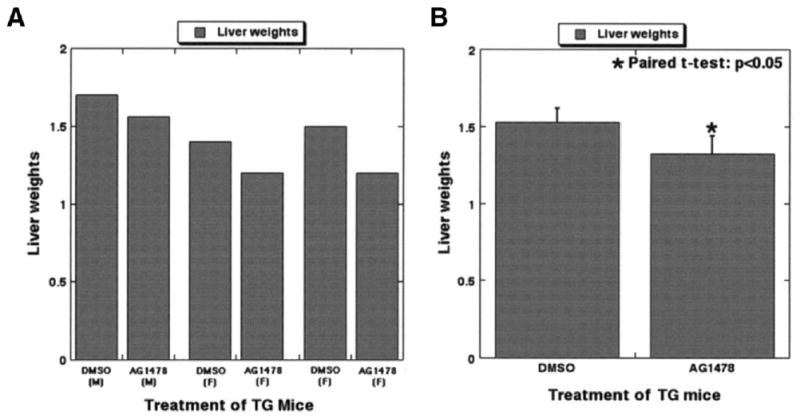
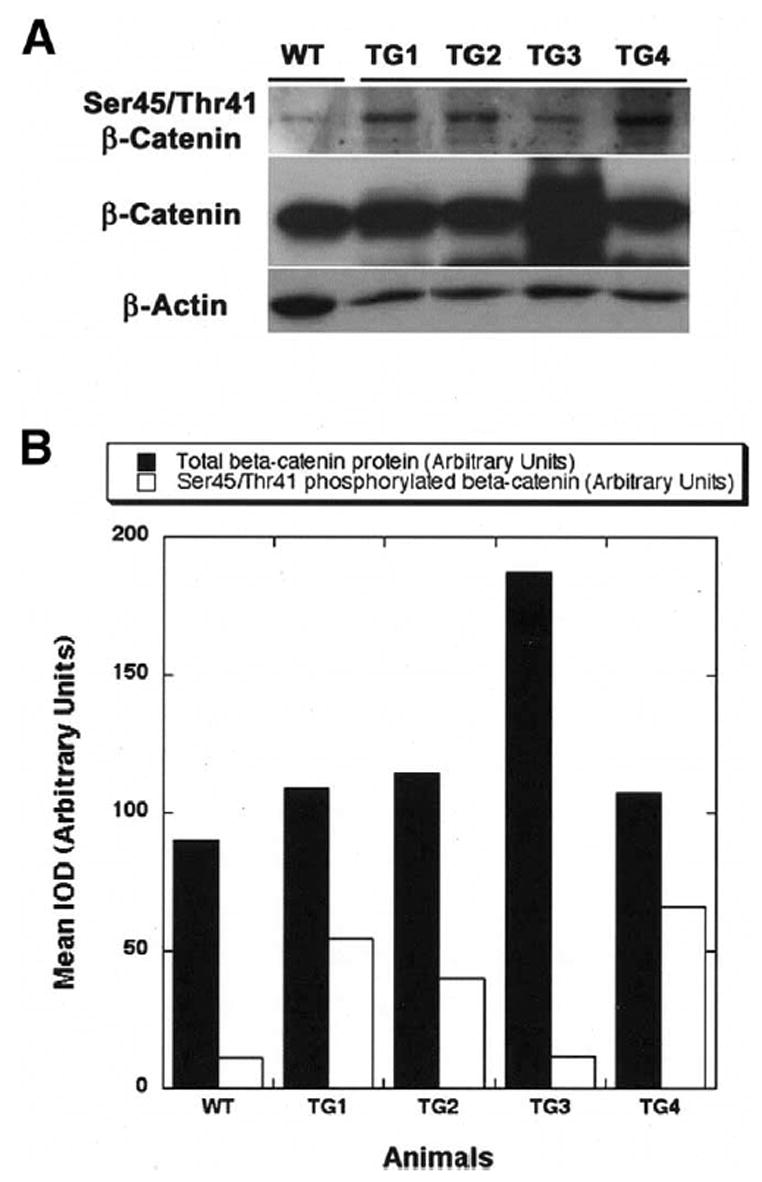
Results: Transgenic livers displayed a significant increase in cytoplasmic, membranous, and nuclear beta-catenin in hepatocytes as compared with their wild-type littermates, which display a predominant membranous localization only. A 15%-20% increase in the liver weight-body weight ratio was evident in transgenic mice secondary to increased hepatocyte proliferation. Microarray analysis showed differential expression of approximately 400 genes in the transgenic livers. Epidermal growth factor receptor RNA and protein and increased levels of activated epidermal growth factor receptor and Stat3 were observed in the transgenic livers. Epidermal growth factor receptor promoter analysis showed a T-cell factor-binding site, and subsequent reporter assay confirmed epidermal growth factor receptor activation in response to Wnt-3A treatment that was abrogated by frizzled related protein 1, a known Wnt antagonist. Epidermal growth factor receptor inhibition successfully decreased liver size in transgenic mice. Next, 7 of 10 hepatoblastomas displayed simultaneous beta-catenin and epidermal growth factor receptor up-regulation, thus suggesting a strong relationship between these 2 proteins in tumors.

Conclusions: beta-Catenin transgenic mice show an in vivo hepatotrophic effect secondary to increased basal hepatocyte proliferation. Epidermal growth factor receptor seems to be a direct target of the pathway, and epidermal growth factor receptor activation might contribute toward some mitogenic effects of increased beta-catenin in liver: epidermal growth factor receptor inhibition might be useful in such states.


Conflict of interest statement

George K. Michalopoulos is a consultant for Kytaron, Corp. There are no other conflicts of interest to be disclosed.

Figures

Figure 1
Figure 1
β-Catenin transgenic mice display successful transgene integration and increased levels of cytoplasmic and nuclear β-catenin protein. (A) A 2.4-kilobase human β-catenin gene (Ctnnb1; open box) was amplified from adult human liver by using primers 1 and 2 and was inserted into the BamH1 site of human growth hormone (h-GH; black boxes) exon 1, regulated by albumin promoter/enhancer (gray box and vertical hatches), and a human growth hormone polyadenylation site (black horizontal hatched box). (B) Eleven founders were confirmed for the transgene by using primers 3 and 4 as compared with the positive controls with purified construct as a template for PCR confirmation (C1 to C4). C1, 1 gene copy per cell equivalent; C2, 5 gene copies per cell equivalent; C3, same as C1 with mouse genomic DNA; C4, same as C2 with mouse genomic DNA. bp, base pairs. (C) A representative analysis showing transgenic status confirmation by PCR in the upper panel and Western blot showing increased total β-catenin protein (1-month-old mice) and actin loading control in the middle panel. The lower panel is a Western blot from additional mice at 3 months of age showing variation in the increased β-catenin levels in transgenic mice. (D) Bar graph displays an overall increase of more than 2-fold in total β-catenin protein in the transgenic livers (n = 20) as compared with wild-type littermates (n = 10) from approximately 1-month-old mice; this is statistically significant (P <.001). IOD, integrated optical density. (E) A representative section from wild-type liver at 3 months of age displays predominantly membranous localization of β-catenin (original magnification, 40×). (F) A representative section from transgenic liver at 3 months of age displays membranous, cytoplasmic (arrow), and nuclear (arrowhead) localization of β-catenin (original magnification, 40×). (G) A representative Western blot using nuclear extracts from livers of 3-month-old male transgenic mice (T1 and T2) and matched control (W) shows increased β-catenin protein in transgenic livers only. (H) A representative electrophoretic mobility shift assay using nuclear lysates from livers of 3-month-old transgenic (T1) and wild-type (W) liver displays β-catenin/TCF binding in the transgenic liver only. F, free probe; Wc, competition with cold probe in wild-type liver nuclear lysate; Tc, competition with cold probe in nuclear lysate from transgenic liver; ATG, methionine start site; L, ladder; P, positive controls; WB, Western blot.
Figure 2
Figure 2
Column comparison by analysis of variance shows a significant increase in the liver weight–body weight ratio by approximately 15% in this representative analysis from 20 transgenic and 10 wild-type littermates (P < .0001). The mean increase was more than 20% if the outliers (liver weight–body weight ratio ≤5.26) were excluded from the analysis. WT, wild type; TG, transgenic.
Figure 3
Figure 3
β-Catenin transgenic mice display increased proliferation, whereas histology and apoptosis remain unaffected. (A) A representative H&E-stained section from a wild-type liver at 3 months of age displays normal hepatic architecture (original magnification, 40×). Inset shows normal hepatocytes (original magnification, 60×). (B) A representative H&E-stained section from a transgenic liver at 3 months of age also displays normal hepatic architecture (original magnification, 40×). Inset also displays normal hepatocytes (original magnification, 60×). (C) TUNEL staining shows minimal apoptosis as seen by the presence of a single apoptotic nucleus (arrowhead) in this field in a wild-type liver. (D) Terminal deoxynucleotidyl transferase–mediated deoxyuridine triphosphate nick-end labeling (TUNEL) staining in a representative transgenic liver also shows comparable numbers of apoptotic nuclei (arrowhead). (E) Representative PCNA staining shows only 1 cell to be positive (arrowhead) in this low-power field (original magnification, 20×) in a 3-month-old wild-type liver. (F) Representative PCNA staining shows many cells to be positive (arrowheads) in this low-power field (original magnification, 20×) in a 3-month-old transgenic liver. (G) High-power magnification of wild-type liver shows no PCNA-positive cells (original magnification, 60×). (H) High-power magnification (original magnification, 60×) of transgenic liver shows 2 PCNA-positive cells (arrowheads).
Figure 4
Figure 4
Bar graph shows a significantly higher proliferation index in transgenic mice as compared with wild-type mice (P < .001). Five fields from 3 transgenic and wild-type livers, aged 3 months, were used for this analysis.
Figure 5
Figure 5
EGFR is regulated by β-catenin in liver and is a direct target of the Wnt/β-catenin pathway. (A) Western blot shows an increase in total EGFR protein in livers from three 1-month-old transgenic male mice as compared with their wild-type male littermates; this was proportional to their β-catenin levels. The lower set of Western blots shows a representative analysis from 3-month-old female transgenic and wild-type littermates showing increased levels of EGFR protein in transgenic livers only. These were also comparable to the total β-catenin levels. The lower EGFR autoradiograph was a very short exposure to highlight the difference between the wild-type and transgenic EGFR content. WT, wild type; TG, transgenic. (B) Normalized mean integrated optical density (IOD) obtained from densitometric analysis of the blots shows more than a 2-fold increase in total EGFR protein in the transgenic livers; this was statistically significant (P < .001). (C) Representative Western blots show increased levels of tyrosine-phosphorylated EGFR in transgenic livers, with minimal levels in wild-type littermates. The upper panel is a Western blot showing tyrosine-phosphorylated EGFR in liver lysates from 3-month-old wild-type males, 3 transgenic males, and 2 transgenic females, along with their respective total β-catenin levels (from left to right). The lower panel shows tyrosine-phosphorylated EGFR in 1 wild-type and 3 transgenic livers from 1-month-old males. Tyr, tyrosine. (D) Column comparison shows a 2.5-fold increase in tyrosine 992/EGFR levels in transgenic livers as compared with the wild-type littermate livers; this is statistically significant (P < .001). (E) Representative Western blots show increased levels of phospho-Stat3 in 3-month-old transgenic livers as compared with control (top). No change was evident in phospho-Erk1/2 levels (middle). β-Actin was used as a loading control (bottom). (F) Wnt-3A–conditioned medium induced approximately 3.0-fold EGFR reporter activity as compared with the control medium that was abrogated by the addition of sFRP-1, a Wnt antagonist. The luciferase activity was normalized to the negative control media.
Figure 6
Figure 6
Concomitant β-catenin and EGFR increase in pediatric hepatoblastomas. (A) Low-power view (original magnification, 5×) shows β-catenin distribution in a pediatric liver with hepatoblastoma. (B) An adjacent section displays a similar distribution of EGFR in the same tumor (original magnification, 5×). (C) Another hepatoblastoma displays aberrant nuclear β-catenin localization in the tumor (original magnification, 20×). (D) An adjacent section shows abnormal EGFR up-regulation in the same sample (original magnification, 20×). (E) Another patient also displays abnormal β-catenin localization in the hepatoblastoma (original magnification, 20×). (F) A consecutive section displays a similar anomalous increase in EGFR (original magnification, 20×). (G) Another hepatoblastoma sample shows abnormal cytoplasmic and nuclear 3-catenin (original magnification, 20×). (H) No EGFR was observed in the adjacent section in this tumor (original magnification, 20×).
Figure 7
Figure 7
EGFR inhibition affected liver weights in transgenic mice. (A) Paired liver weights (sex matched) from 3-month-old transgenic mice after AG1478 or DMSO treatment for 5 weeks are displayed in this bar graph, which shows a consistent decrease in the experimental group. (B) Paired t tests showed a significant decrease in liver weights in the experimental group as compared with the controls (P < .05), thus confirming the role of EGFR in β-catenin–induced increase in liver size.
Figure 8
Figure 8
Increased degradation of β-catenin enables maintenance of its normal levels in a subset of transgenic mice. (A) A representative Western blot analysis shows increased levels of serine 45/threonine 41–phosphorylated β-catenin, corresponding to lower levels of total β-catenin in livers (TG1, TG2, and TG4) of 1-month-old transgenic mice. The higher levels of total β-catenin protein corresponded to less phosphorylation (TG3) and more cytoplasmic and nuclear localization (not shown). (B) A bar graph depicts a clear inverse relationship between total β-catenin levels in arbitrary units (closed box) and serine 45/threonine 41–phosphorylated β-catenin (open box), thus indicating some transgenic animals can regulate β-catenin levels by enhancing its degradation. Wild-type livers display reasonable levels of β-catenin and less phosphorylation; however, the gene expression is also very low as compared with all transgenic mice (not shown). WT, wild type; TG, transgenic; IOD, integrated optical density.

Similar articles

Cited by

References

    1. Pennisi E. How a growth control path takes a wrong turn to cancer (published erratum appears in Science 1998;281:1809) Science. 1998;281:1438–1439. 1441. - PubMed
    1. Polakis P. Wnt signaling and cancer. Genes Dev. 2000;14:1837–1851. - PubMed
    1. Huelsken J, Vogel R, Erdmann B, Cotsarelis G, Birchmeier W. beta-Catenin controls hair follicle morphogenesis and stem cell differentiation in the skin. Cell. 2001;105:533–545. - PubMed
    1. Huelsken J, Vogel R, Brinkmann V, Erdmann B, Birchmeier C, Birchmeier W. Requirement for beta-catenin in anterior-posterior axis formation in mice. J Cell Biol. 2000;148:567–578. - PMC - PubMed
    1. Haegel H, Larue L, Ohsugi M, Fedorov L, Herrenknecht K, Kemler R. Lack of beta-catenin affects mouse development at gastrulation. Development. 1995;121:3529–3537. - PubMed

Publication types

MeSH terms