

Assessment of the health of Americans: the average health-related quality of life and its inequality across individuals and groups
- PMID: 16014174
- PMCID: PMC1192818
- DOI: 10.1186/1478-7954-3-7
Assessment of the health of Americans: the average health-related quality of life and its inequality across individuals and groups
Abstract
Background: The assessment of population health has traditionally relied on the population's average health measured by mortality related indicators. Researchers have increasingly recognized the importance of including information on health inequality and health-related quality of life (HRQL) in the assessment of population health. The objective of this study is to assess the health of Americans in the 1990s by describing the average HRQL and its inequality across individuals and groups.
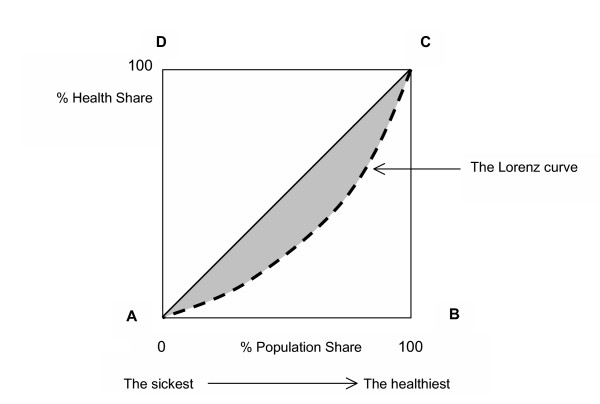
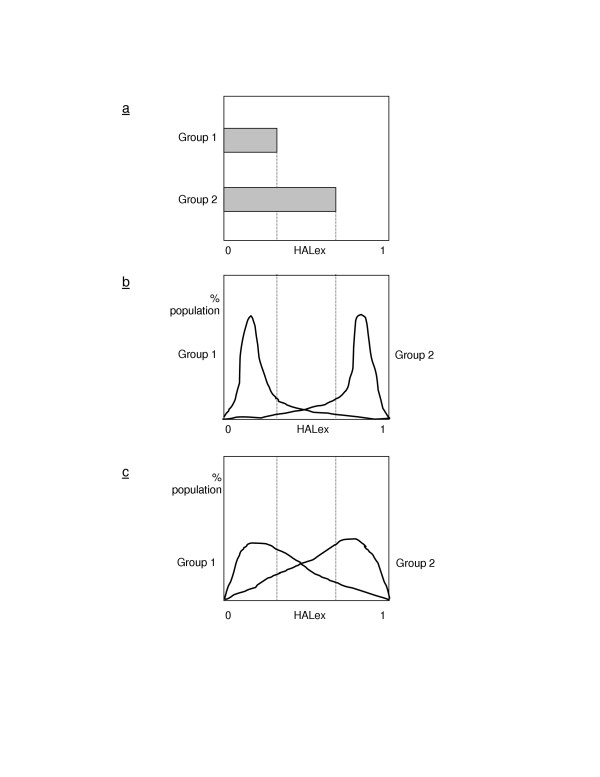
Methods: This study uses the 1990 and 1995 National Health Interview Survey from the United States. The measure of HRQL is the Health and Activity Limitation Index (HALex). The measure of health inequality across individuals is the Gini coefficient. This study provides confidence intervals (CI) for the Gini coefficient by a bootstrap method. To describe health inequality by group, this study decomposes the overall Gini coefficient into the between-group, within-group, and overlap Gini coefficient using race (White, Black, and other) as an example. This study looks at how much contribution the overlap Gini coefficient makes to the overall Gini coefficient, in addition to the absolute mean differences between groups.
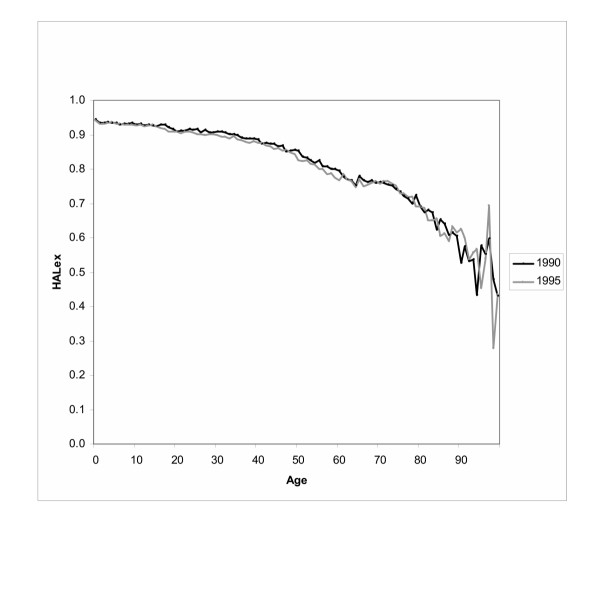
Results: The average HALex was the same in 1990 (0.87, 95% CI: 0.87, 0.88) and 1995 (0.87, 95% CI: 0.86, 0.87). The Gini coefficient for the HALex distribution across individuals was greater in 1995 (0.097, 95% CI: 0.096, 0.099) than 1990 (0.092, 95% CI: 0.091, 0.094). Differences in the average HALex between all racial groups were the same in 1995 as 1990. The contribution of the overlap to the overall Gini coefficient was greater in 1995 than in 1990 by 2.4%. In both years, inequality between racial groups accounted only for 4-5% of overall inequality.
Conclusion: The average HRQL of Americans was the same in 1990 and 1995, but inequality in HRQL across individuals was greater in 1995 than 1990. Inequality in HRQL by race was smaller in 1995 than 1990 because race had smaller effect on the way health was distributed in 1995 than 1990. Analysis of the average HRQL and its inequality provides information on the health of a population invisible in the traditional analysis of population health.
Figures
References
-
- Arias E, Anderson RN, Kung H, Murphy SL, Kochanek KD. Deaths: final data for 2001. National Vital Statistics Reports. 2003;52:1–115. - PubMed
-
- National Center for Health Statistics . Health, United States, with chartbook on trends in the health of Americans. Hyattsville, Maryland; 2004. - PubMed
-
- Health Canada . Taking action on population health: a position paper for health promotion and programs branch staff. Ottawa; 1999.
-
- World Health Organization . The World Health Report 2000: Health systems: Improving performance. Geneva; 2000.
-
- U.S. Department of Health and Human Services . Healthy people 2010: Understanding and improving health. Washington, DC; 2000.
Grants and funding
LinkOut - more resources
Full Text Sources
