. 2005 Nov;289(5):C1094-104.
doi: 10.1152/ajpcell.00329.2004. Epub 2005 Jul 13.

Somatic vs. dendritic responses to hypercapnia in chemosensitive locus coeruleus neurons from neonatal rats

Affiliations

Somatic vs. dendritic responses to hypercapnia in chemosensitive locus coeruleus neurons from neonatal rats

Nick A Ritucci et al. Am J Physiol Cell Physiol. 2005 Nov.

Abstract

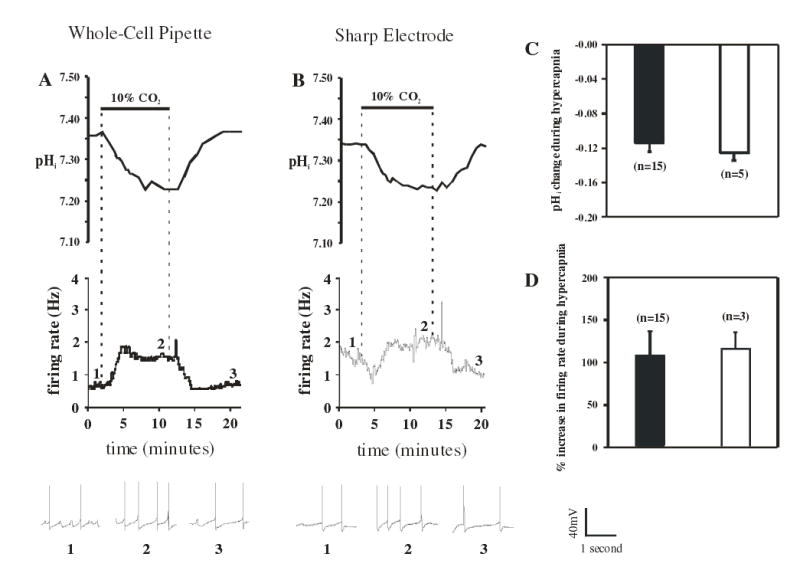
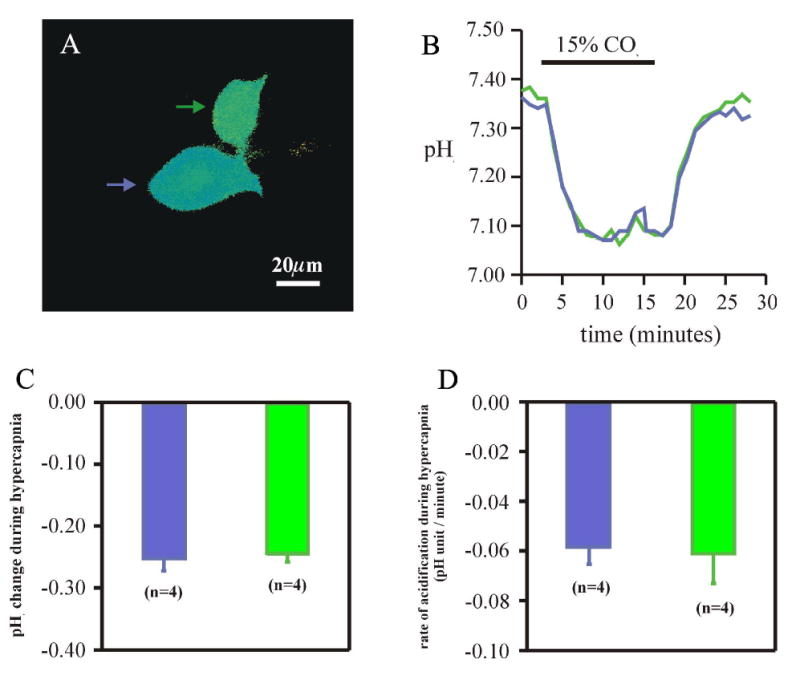
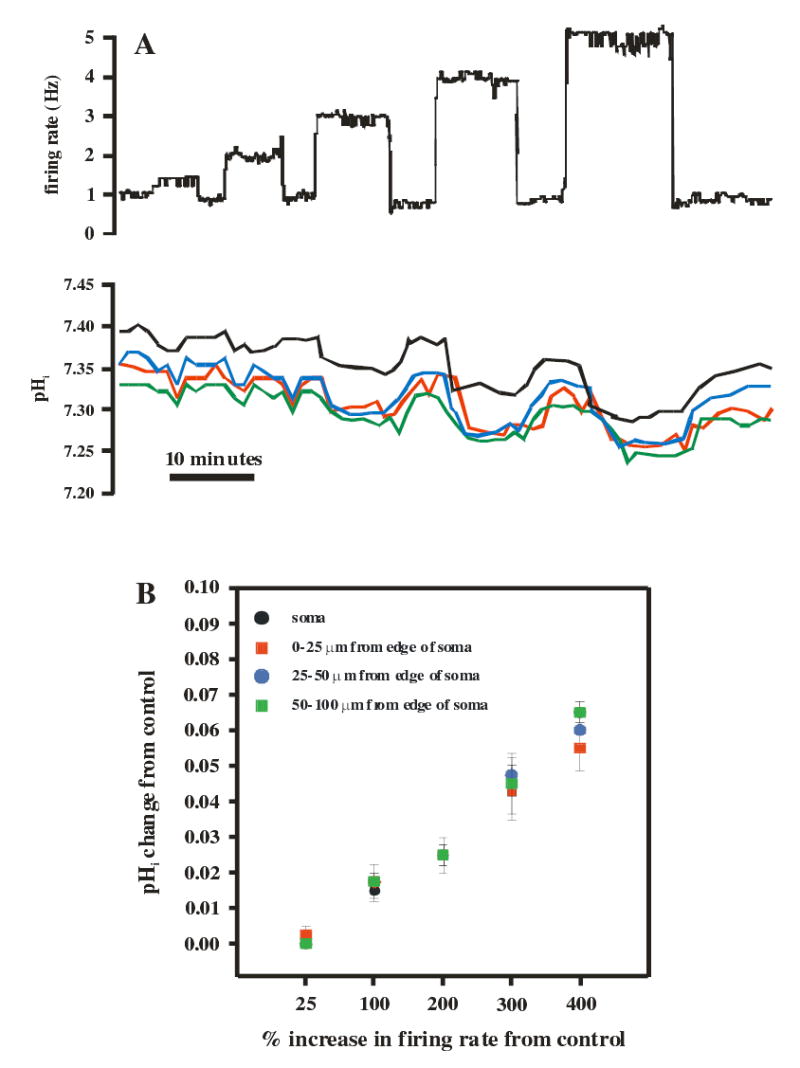
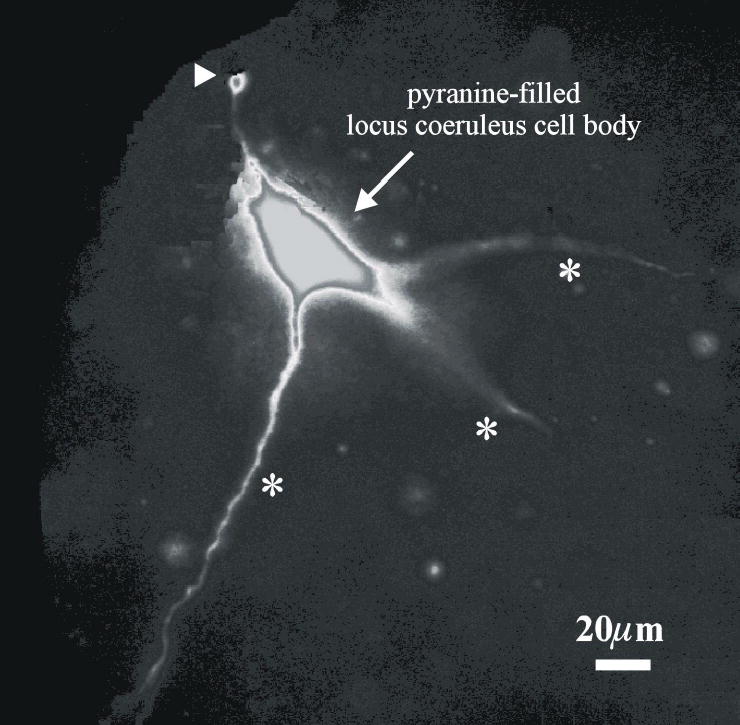
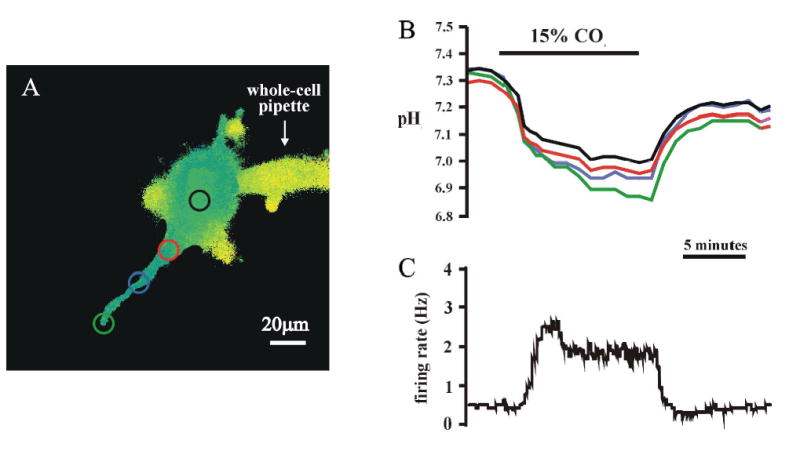
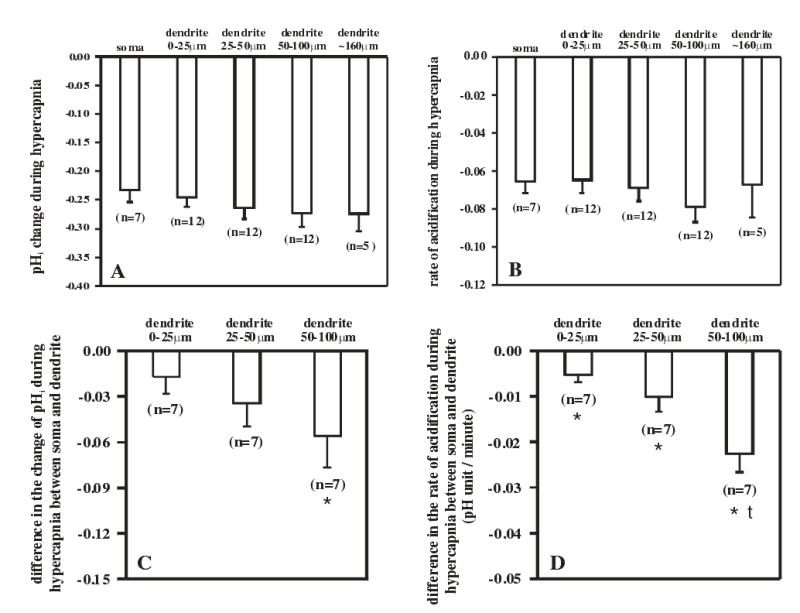
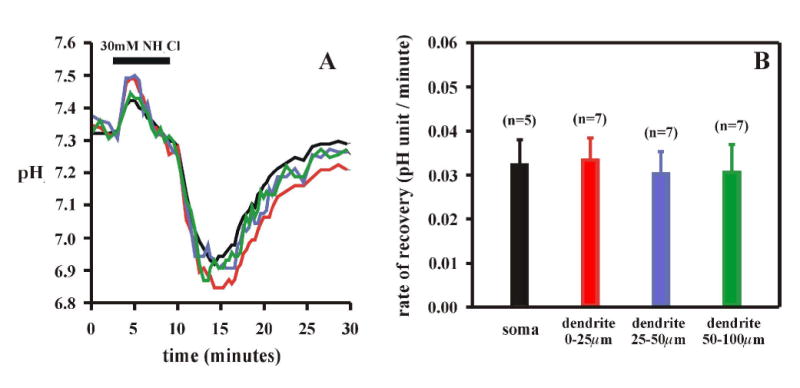
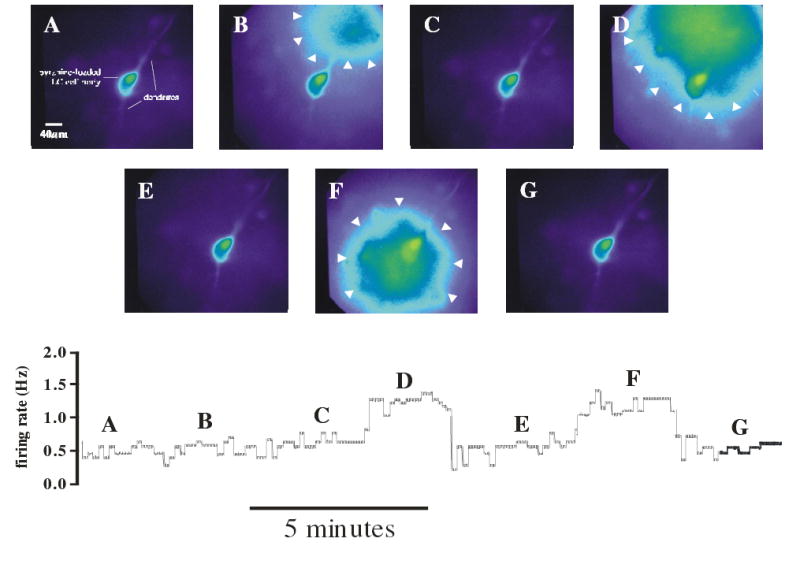
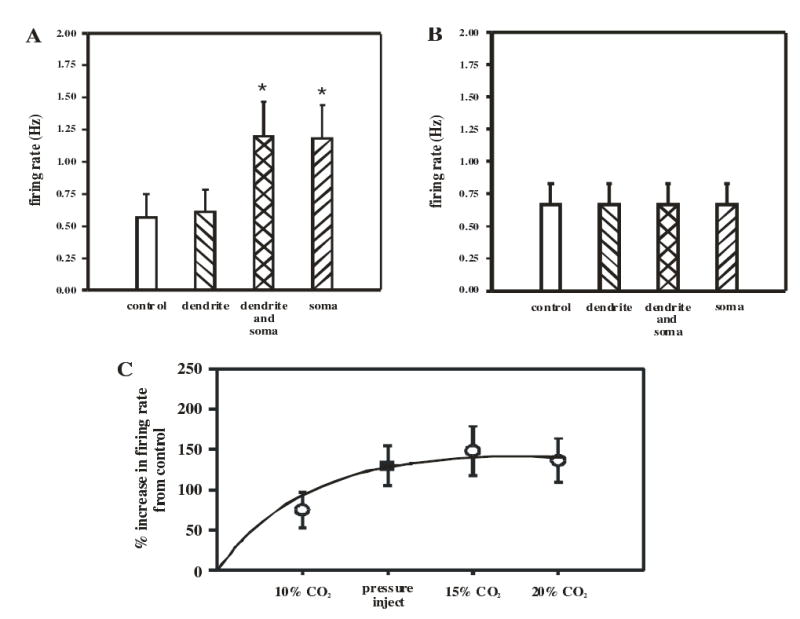
Cardiorespiratory control is mediated in part by central chemosensitive neurons that respond to increased CO(2) (hypercapnia). Activation of these neurons is thought to involve hypercapnia-induced decreases in intracellular pH (pH(i)). All previous measurements of hypercapnia-induced pH(i) changes in chemosensitive neurons have been obtained from the soma, but chemosensitive signaling could be initiated in the dendrites of these neurons. In this study, membrane potential (V(m)) and pH(i) were measured simultaneously in chemosensitive locus coeruleus (LC) neurons from neonatal rat brain stem slices using whole cell pipettes and the pH-sensitive fluorescent dye pyranine. We measured pH(i) from the soma as well as from primary dendrites to a distance 160 mum from the edge of the soma. Hypercapnia [15% CO(2), external pH (pH(o)) 7.00; control, 5% CO(2), pH(o) 7.45] resulted in an acidification of similar magnitude in dendrites and soma ( approximately 0.26 pH unit), but acidification was faster in the more distal regions of the dendrites. Neither the dendrites nor the soma exhibited pH(i) recovery during hypercapnia-induced acidification; but both regions contained pH-regulating transporters, because they exhibited pH(i) recovery from an NH(4)Cl prepulse-induced acidification (at constant pH(o) 7.45). Exposure of a portion of the dendrites to hypercapnic solution did not increase the firing rate, but exposing the soma to hypercapnic solution resulted in a near-maximal increase in firing rate. These data show that while the pH(i) response to hypercapnia is similar in the dendrites and soma, somatic exposure to hypercapnia plays a major role in the activation of chemosensitive LC neurons from neonatal rats.


Figures

Figure 1
Figure 1
Simultaneous measurements of pHi and firing rate in response to hypercapnia (10% CO2; pHo 7.15) of LC neurons measured with either whole-cell pipettes or sharp electrodes. A: The pHi (top trace) and integrated firing rate (middle trace) as a function of time in response to hypercapnia as measured with a whole-cell pipette. Note the reversible and maintained acidification and increased firing rate in response to hypercapnia. Brief segments of individual action potentials are shown in the bottom trace. The segments were taken from the numbered regions as indicated in the middle trace. Time and voltage calibrations for these traces are indicated to their right. B: The pHi (top trace) and integrated firing rate (middle trace) as a function of time in response to hypercapnia as measured with a sharp electrode. Brief segments of individual action potentials are shown in the bottom trace. The segments were taken from the numbered regions as indicated in the middle trace. Time and voltage calibrations for these traces are indicated to their right. C: The mean (± 1 SEM) of the hypercapnia-induced change of pHi measured with whole-cell pipettes (filled bars) or sharp electrodes (open bars). Hypercapnia-induced acidification (about 0.12 pH unit) was the same when measured with either technique. D: The mean (± 1 SEM) of the hypercapnia-induced % increase in firing rate measured with whole-cell pipettes (filled bars) or sharp electrodes (open bars). Hypercapnia-induced increase firing rate (about 100%) was the same when measured with either technique.
Figure 2
Figure 2
Comparison of the pHi response to hypercapnia in detached vs. attached LC neurons. A: A pseudocolor image of the somata of two pyranine-loaded LC neurons. One was previously loaded with a whole cell pipette that was then detached from the cell body (green), while the other was loaded and still has the whole-cell pipette attached (blue). B: The pHi response of the two neurons to hypercapnia (15% CO2, pHo 7.00). C: The magnitude of the pHi change in the soma induced by hypercapnia for attached (blue) and detached (green) LC neurons. D: The rate of the acidification induced by hypercapnia for attached (blue) and detached (green) LC neurons. Note that the change of pHi and the rate of acidification are the same in both attached and detached soma. The height of a bar represents the mean and the error bar represents 1 SEM.
Figure 3
Figure 3
Determination of the effect of firing rate on pHi. A. Constant depolarizing current pulses (5–10 min duration) were injected into a whole-cell patched LC neuron to increase firing rate (top panel) while simultaneously measuring pHi (bottom panel). The current injected was varied to increase firing rate by 25% (similar to increase seen with 10% CO2), 100%, 200%, 300% or 400% and was done in a stepwise manner. The neuron was allowed to return to resting firing rate and pHi between each step. The change of pHi during each step was determined in the soma and at various regions along the dendrite (0–25, 25–50 and 50–100 μm from the edge of the soma). B. The mean (± 1 SEM) of the change of pHi as a function of the % change in firing rate. Note the linear relationship between the two, the similar pHi changes in the soma and dendrites, and the small magnitude of the change of pHi for even large increases in firing rate.
Figure 4
Figure 4
A monochrome image of an LC neuron loaded with pyranine and imaged at high gain. Note the three dendrites (denoted by *), one of which remains in focus for about 100 μm. Note also, a fourth dendrite that has been pruned by slice preparation, as is evident from the fluorescent bleb at its end (arrow head).
Figure 5
Figure 5
Simultaneous measurement of the firing rate response and the pHi response to hypercapnia (15% CO2, pHo 7.00) in the soma and a dendrite of an LC neuron. A: A pseudocolor image of an LC neuron with the dye-filled pipette attached. The four colored circles show the areas of interest that were studied. B: The pHi response to hypercapnia in the soma and in three areas of a dendrite (0–25, 25–50 and 50–100 μm from the edge of the soma). C: The integrated firing rate response to hypercapnia, measured with the whole cell pipette.
Figure 6
Figure 6
A comparison of the magnitude and the rate of hypercapnia-induced acidification in the soma and dendrites of LC neurons. A: A comparison of the magnitude of hypercapnia-induced acidification of the soma and of four dendritic regions. The mean values (± 1 SEM) for the magnitude of hypercapnia-induced acidification in various regions of LC neuron are shown and do not differ among the various regions. B. The mean values (± 1 SEM) for the rate of acidification induced by hypercapnia in various regions of LC neurons. The rates for the various regions are not significantly different. C. The paired difference (mean ± 1 SEM) between the magnitude of acidification for a particular region of the dendrite and the acidification of the soma for 7 neurons (like the one shown in Fig. 5A) where we have values for both the soma and dendrites. Only for the most distant dendritic region is the magnitude of acidification significantly larger than the acidification of the soma. The values for the three dendritic regions do not differ significantly from one another. D: The paired difference (mean ± 1 SEM) between the rate of acidification for a particular region of the dendrite and the rate of acidification of the soma for 7 neurons (like the one shown in Fig. 5A) where we have values for both the soma and dendrites. All three dendritic regions acidify significantly more rapidly than the soma, and the most distant dendritic region acidifies significantly more rapidly than the other dendritic regions. An * indicates that the difference value is significantly different from 0 (P<0.05) and a † indicates that the difference value for a dendritic region is different from the other the values for the other two regions (P<0.05).
Figure 7
Figure 7
A: The pHi response to an NH4Cl prepulse (30 mM) of the soma and of three dendritic regions (0–25, 25–50 and 50–100 μm from the soma) of LC neurons. B: Mean values (± 1 SEM) of the rate of pHi recovery from an NH4Cl prepulse-induced acidification in the soma and in the three dendritic regions. None of the recovery rates differed significantly among the various regions.
Figure 8
Figure 8
Microinjection of hypercapnic acidotic solution on a dendrite or soma of an LC neuron and its effect on firing rate. A. An LC neuron patched with a whole cell pipette and loaded with pyranine. The soma and two dendrites are evident. B. A hypercapnic solution was microinjected for 2 min over one of the dendrites using a pipette filled with hypercapnic solution containing pyranine that was positioned over the distal region of a dendrite. The area covered by the hypercapnic solution was visualized as the extracellular pyranine fluorescence and encompassed a region approximately 100 μm in diameter (indicated by white arrowheads). C. The microinjection was stopped and the extracellular hypercapnic solution rapidly washed away. D. The microinjection pipette was moved to a more proximal dendritic position and the microinjection repeated. In this case, the area encompassed by the hypercapnic solution included a proximal dendrite and the soma (white arrowheads). E. Once again, the microinjection was stopped and the external solution allowed to return to normal. F. The microinjection pipette was moved adjacent to the soma and the microinjection repeated. The hypercapnic solution covered the soma and the proximal dendrites. G. The microinjection was stopped and the hypercapnic solution allowed to wash away. Lower Panel: The integrated firing rate of the LC neuron depicted in A–G. The firing rate corresponding to each image is indicated by the letter of that image above the firing rate trace. Note that the hypercapnic solution did not increase firing rate when microinjected over a distal dendrite (point B), but increased firing rate reversibly when microinjected over the proximal dendrites and soma (points D and F).
Figure 9
Figure 9
The summary of the firing rate responses to focal microinjection of hypercapnic solutions in LC neurons. A. The mean (± 1 SEM; n=5) of the firing rate when LC neurons are exposed to control solution and microinjection of hypercapnic solution over the distal dendrites alone, the proximal dendrites and soma, and the soma. The firing rate increases significantly (*) only when the area covered by the hypercapnic solution includes the soma. B. The mean (± 1 SEM; n=4) of the firing rate when LC neurons are exposed to microinjection of control solution (equilibrated with 5% CO2) over the distal dendrites, the proximal dendrites and soma, and the soma. There was no increase in firing rate when normocapnic solution was microinjected over any area of LC neurons. C. The relationship of the % increase in firing rate of LC neurons when the whole slice is superfused (open circles) with solution equilibrated with different levels of hypercapnic (from 10–20% CO2). The % increase in firing rate increases with the degree of hypercapnia up to 15% CO2 and then plateaus. Each point represents the mean % increase in firing rate (± 1 SEM; n=9). The filled square represents the mean (± 1 SEM; n=5) % increase in firing rate with microinjection of hypercapnic solution over the soma of LC neurons. Note this microinjection induces a near maximal increase in firing rate.

Similar articles

Cited by

References

    1. Andrzejewski M, Mückenhoff K, Scheid P, Ballantyne D. Synchronized rhythms in chemosensitive neurons of the locus coeruleus in the absence of chemical synaptic transmission. Resp Physiol. 2001;129:123–140. - PubMed
    1. Ballantyne D, Scheid P. Central chemosensitivity of respiration: a brief overview. Resp Physiol. 2001;129:5–12. - PubMed
    1. Ballanyi K, Mückenhoff K, Bellingham MC, Okada Y, Scheid P, Richter DW. Activity-related pH changes in respiratory neurones and glial cells of cats. Neuroreport. 1994;6:33–36. - PubMed
    1. Boron WF. Intracellular pH transients in giant barnacle muscle fibers. Am J Physiol Cell Physiol. 1977;233:C61–C73. - PubMed
    1. Boron WF, De Weer P. Intracellular pH transients in squid giant axons caused by CO2, NH3, and metabolic inhibitors. J Gen Physiol. 1976;67:91–112. - PMC - PubMed

Publication types

LinkOut - more resources