Comparative Study
. 2005 Jul 13;25(28):6520-32.
doi: 10.1523/JNEUROSCI.1264-05.2005.

Modeling cooperative volume signaling in a plexus of nitric-oxide-synthase-expressing neurons

Affiliations
Comparative Study

Modeling cooperative volume signaling in a plexus of nitric-oxide-synthase-expressing neurons

Andrew Philippides et al. J Neurosci. .

Abstract

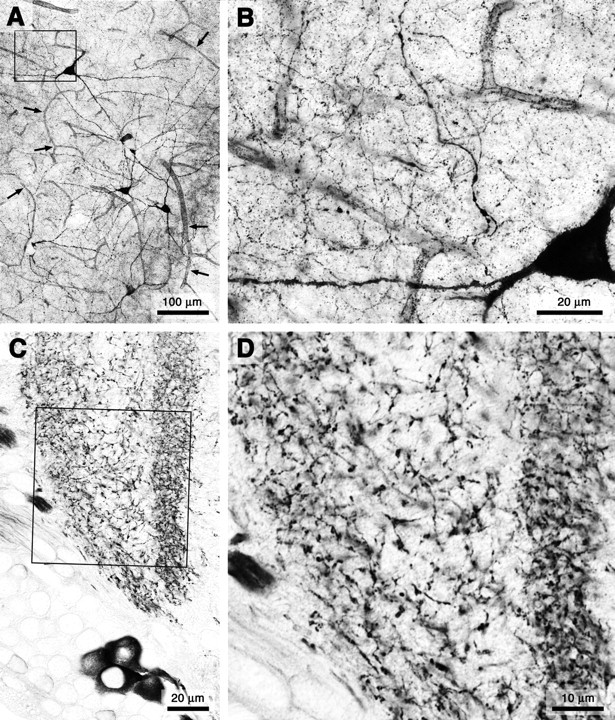
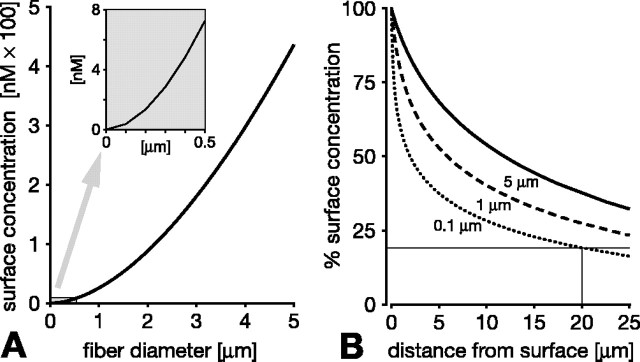
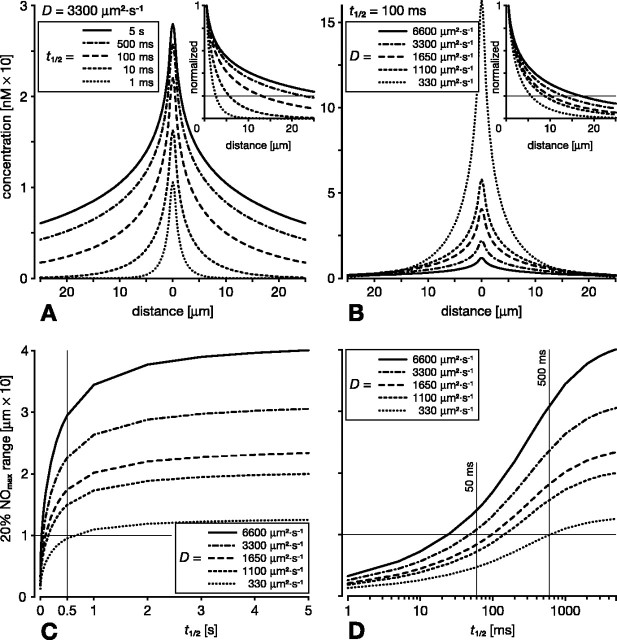
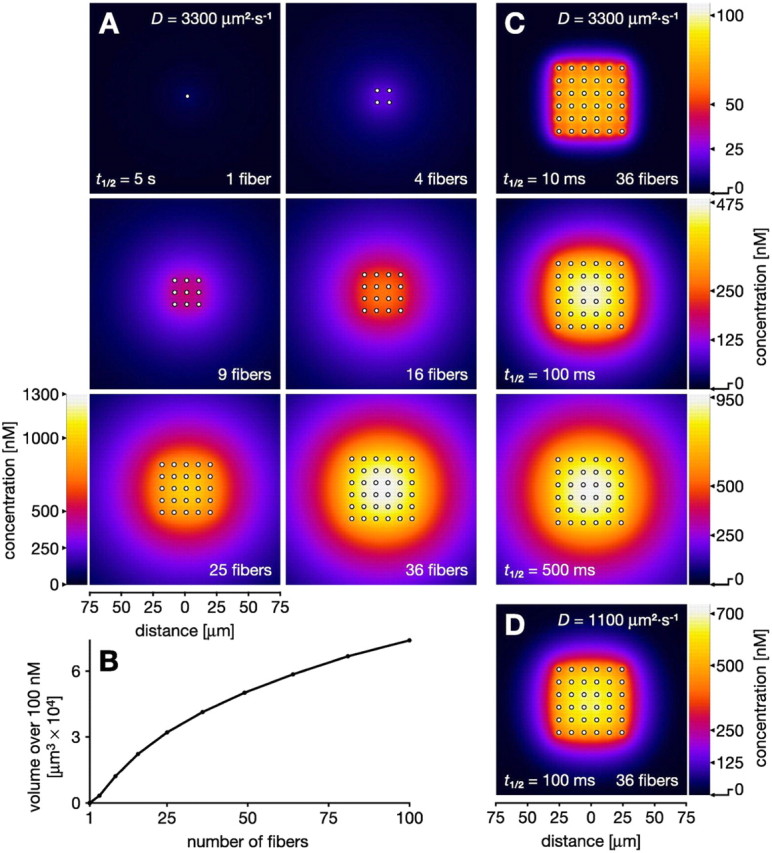
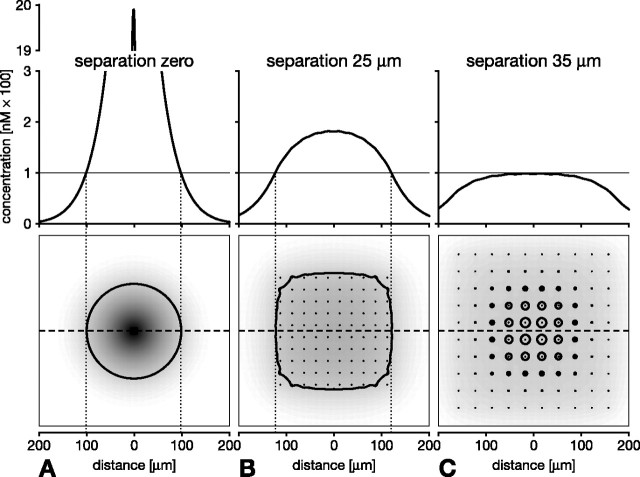
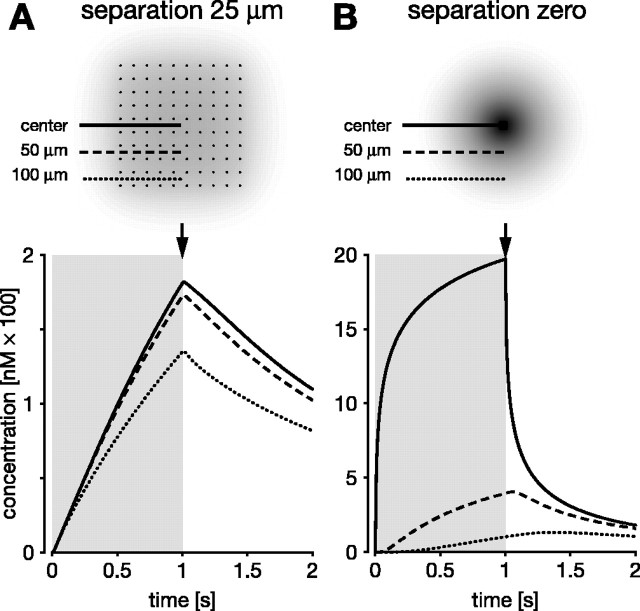
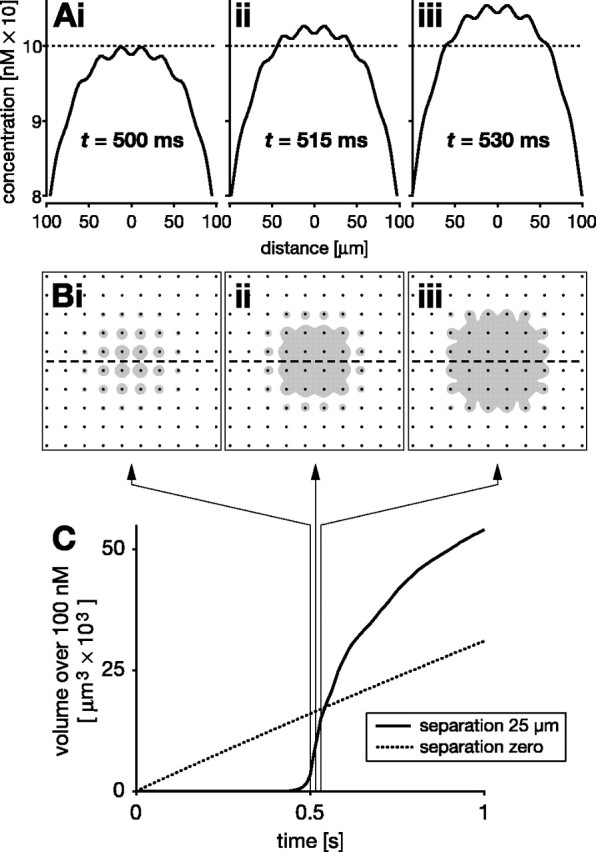
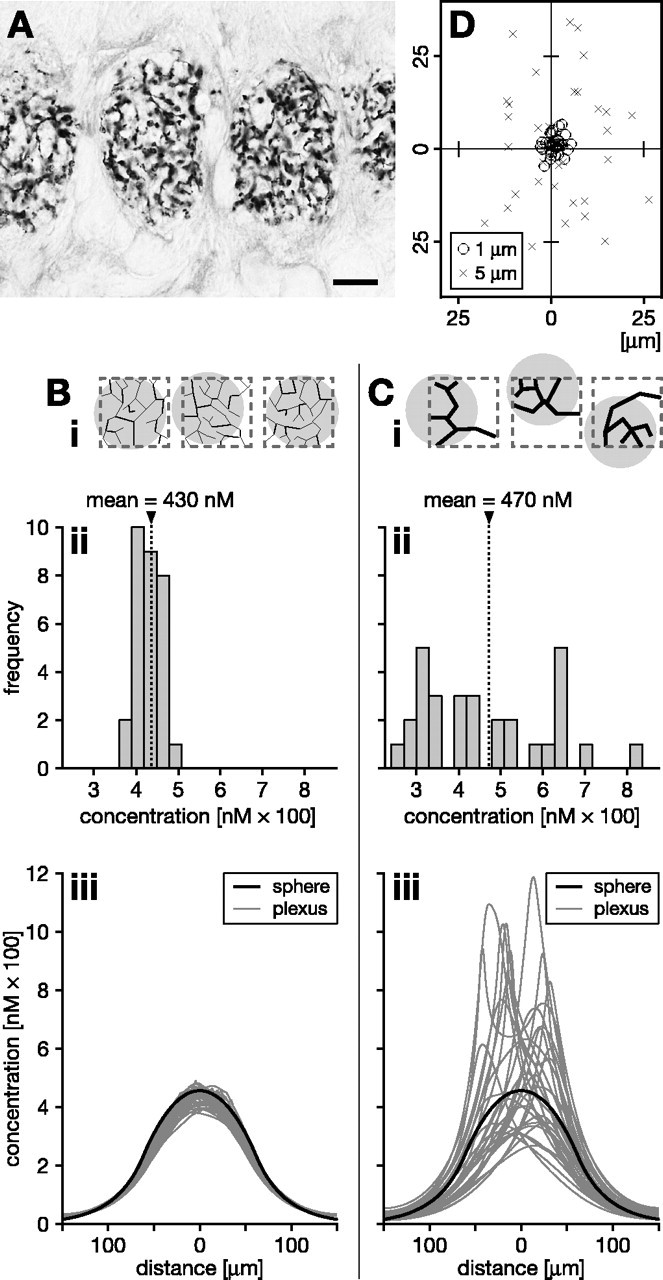
In vertebrate and invertebrate brains, nitric oxide (NO) synthase (NOS) is frequently expressed in extensive meshworks (plexuses) of exceedingly fine fibers. In this paper, we investigate the functional implications of this morphology by modeling NO diffusion in fiber systems of varying fineness and dispersal. Because size severely limits the signaling ability of an NO-producing fiber, the predominance of fine fibers seems paradoxical. Our modeling reveals, however, that cooperation between many fibers of low individual efficacy can generate an extensive and strong volume signal. Importantly, the signal produced by such a system of cooperating dispersed fibers is significantly more homogeneous in both space and time than that produced by fewer larger sources. Signals generated by plexuses of fine fibers are also better centered on the active region and less dependent on their particular branching morphology. We conclude that an ultrafine plexus is configured to target a volume of the brain with a homogeneous volume signal. Moreover, by translating only persistent regional activity into an effective NO volume signal, dispersed sources integrate neural activity over both space and time. In the mammalian cerebral cortex, for example, the NOS plexus would preferentially translate persistent regional increases in neural activity into a signal that targets blood vessels residing in the same region of the cortex, resulting in an increased regional blood flow. We propose that the fineness-dependent properties of volume signals may in part account for the presence of similar NOS plexus morphologies in distantly related animals.


Figures

Figure 1.
Figure 1.
Plexus morphology of NOS-expressing fibers in the brain of a vertebrate (rat; A, B) and an insect (locust; C, D). Both groups of animals have convergently adopted an NO source architecture in which extensive meshworks of exceedingly fine fibers arise from comparatively few neurons. A, The plexus of NOS-expressing fibers in the rat cerebral cortex arises from a scattered population of neurons. Targets include both an extensive volume of (synaptic) gray matter and the blood vessels within it (small arrows in A). B, High-power image of the region indicated by the black frame in A reveals the ubiquity of exceedingly fine fibers that constitute the plexus. C, The plexus of NOS-expressing fibers in the medulla of the locust optic lobe is similarly derived from few neurons and pervades an extensive volume of synaptic neuropil. D, High-power view of the region indicated by the black frame in C.
Figure 2.
Figure 2.
The signaling efficacy of a single NO-producing fiber critically depends on its diameter. A, The NO concentration at the fiber surface declines dramatically for thinner fibers. Surface concentrations after 1 s of continuous synthesis are 440, 25.5, and 0.37 nm for fiber diameters of 5, 1, and 0.1 μm, respectively (diameters chosen with reference to B). The inset in A shows the graph at a larger scale for diameters below 0.5 μm. B, The problem of the lower surface concentration of thinner fibers is exacerbated by a steeper decline of the NO concentration as one moves away from the fiber surface. NO concentration is plotted over distance from the fiber surface as percentage of the surface concentration for fiber diameters of 5 μm (solid line in B), 1 μm (dashed line in B), and 0.1 μm (dotted line in B). Note, however, that even very thin (0.1 μm) fibers reach ∼20% of the surface concentration 20 μm away from the surface after 1 s of synthesis (hairlines in B). This extensive spread is the basis of cooperative volume signaling (compare with Fig. 4).
Figure 3.
Figure 3.
Influence of half-life (t1/2) and diffusion coefficient (D) on the spread of NO from a single fiber of 1 μm diameter after 1 s of continuous NO synthesis. Main plots in A and B show the absolute NO concentrations plotted against distance from the center of the fiber. In the insets, these concentrations are normalized to the concentration at the fiber surface. The distance over which the concentration drops to 20% of the surface concentration (the 20% NOmax range; hairline in insets) serves as a measure of the relative spread. A, Varying t1/2 5000-fold between 5 s and 1 ms while keeping D constant at 3300 μm2 · s-1 has little effect on the NO concentration at the source (∼30 and ∼10 nm, respectively). Although concentrations are affected more at distant points (as is evident from the diverging lines in the inset), the spread is curtailed significantly only when t1/2 is substantially shorter than 100 ms. For example, 10 μm away from the source, the concentration is only halved by reducing t1/2 from 5 s to 100 ms. Likewise, the 20% NOmax range drops below 10 μm only when t1/2 is significantly shorter than 100 ms (hairline in inset). B, Varying D between 2× and 0.1× its standard value while keeping t1/2 constant at 100 ms impacts on the absolute concentration at the source but has much less effect at more distant points. The relative spread is likewise little affected (inset in B). A significant drop of the 20% NOmax range below 10 μm is predicted only with D = 330 μm2 · s-1, 1/10 of its standard value. C, D, The 20% NOmax range shown as a function of t1/2 for different D values. C, Varying t1/2 between 5 and ∼0.5 s has no significant effect on the spread, and the 20% NOmax range is 10 μm or more even for D = 330 μm2 · s-1 (crossed hairlines). D, Over the range of t1/2 = 50-500 ms, spread changes more steeply. Importantly, however, with physiologically realistic values of D > 1000 μm2 · s-1, the 20% NOmax range is of the order of 10 μm or more (crossed hairlines).
Figure 4.
Figure 4.
Cooperative volume signals produced by ordered arrays of parallel NO-synthesizing fibers after 1 s of synthesis. Fiber diameters (2 μm) and spacing (10 μm) approximate that in the locust optic lobe (Elphick et al., 1996). A, Concentration distribution of NO in 300 × 300 μm2 slices across increasing numbers of active fibers (indicated by white dots). A single fiber is a relatively ineffectual NO source (1 fiber in A). Increasing numbers of fibers separated by 10 μm result in a cumulative buildup of NO to substantial concentrations (4-36 fibers in A). B, As the number of fibers increases, so does the volume that is affected by an NO signal over a particular concentration, here 100 nm. C, Cooperative generation of a volume signal is robust to variation in half-life (t1/2) within the limits reported in the literature. When t1/2 is reduced to 100 ms (Griffiths and Garthwaite, 2001), 1/50 of the value in A, the concentrations in the target volume fall to only approximately one-third (250-475 vs 700-1300 nm). Further reduction of t1/2 to 10 ms yields a more spiky concentration distribution with 100 nm peaks at the fibers. However, at least 50% or more of this peak concentration is still reached everywhere throughout the target volume. D, Strong cooperation is still observed when t1/2 is relatively short (100 ms) and D is reduced to 1100 μm2 · s-1, one-third of its standard value. Compared with the result with standard D (middle part of C), the volume signal shows less encroachment into areas outside the array.
Figure 5.
Figure 5.
Separation of the source fibers critically determines the spatial distribution of NO. Concentrations after 1 s of synthesis are shown for an ordered array of 10 × 10 parallel fibers of 1 μm diameter. Bottom row, The resultant NO cloud (shaded) in a 400 × 400 μm2 slice across the fibers (black dots indicate fiber profiles). Top row, Concentration profile along the dashed line through the center of the array. A, Contiguous arrangement of the fibers leads to a sharp local NO peak of nearly 2 μm, because they act as a single 10 × 10 μm source. B, Separation of the fibers by 25 μm results in a much broader and more homogeneous distribution. The peak concentration is ∼10 times lower than in A, but the region that experiences concentrations over 100 nm (heavy black outlines in bottom row) is substantially larger in B. C, Further increase in separation to 35 μm yields an even more homogeneous concentration profile, but the region over 100 nm is dramatically reduced and discontinuous. Note that, in A-C, the same amount of NO was produced over the same time.
Figure 6.
Figure 6.
Separation of the source fibers promotes synchrony and uniformity of the NO volume signal. Local NO concentrations generated during and after 1 s of synthesis by an ordered array of 10 × 10 fibers (fiber diameter of 1 μm), measured at three points: at the center of the array (solid lines) and 50 μm (dashed lines) and 100 μm (dotted lines) away from the center. The duration of synthesis indicated by gray rectangles in bottom row. Top row, Points of measurement and fiber profiles (black dots) superimposed on a snapshot of the spatial NO distribution (shaded) at the end of synthesis (arrows). A, Fibers separated by 25 μm. The entire region synchronously experiences a very similar time course of NO that is characterized by a relatively slow and approximately linear rise and fall. B, Fibers arranged contiguously so they act as a single 10 × 10 μm source. The center instantaneously experiences concentrations far in excess of 100 nm; rise and fall are highly nonlinear. Points away from the center encounter a much slower rise and fall with different temporal characteristics depending on their distance from the center. In particular, the farther from the center, the longer NO continues to rise after the end of synthesis.
Figure 7.
Figure 7.
Delayed volume signaling by separated NO sources (10 × 10 array of 1-μm-diameter NO-synthesizing fibers separated by 25 μm). A, B, Spatial concentration distributions at three time points after the onset of synthesis: 500 ms (i), 515 ms (ii), and 530 ms (iii). A, NO concentration profiles across the center of the array, along the dashed line in B. For illustrative purposes, a nominal threshold concentration of 100 nm is assumed (dotted line in A). B shows the region over 100 nm (gray) in cross sections through the array (fibers are indicated by black dots). There is a substantial delay between the onset of synthesis and NO reaching 100 nm anywhere within the volume of the array. After 500 ms of continuous synthesis (i in A, B), NO reaches 100 nm in the vicinity of central fibers. Additional synthesis pushes a large part of the target volume near simultaneously over 100 nm (ii, iii in A, B). C, Plotting the volume that experiences >100 nm NO over time shows a sharp, nonlinear rise after an initial delay of ∼500 ms (solid line). Three hairlines with arrows indicate the time points shown in A and B. Also shown for comparison is the near-linear rise (dotted line in C) that is observed for the volume over 100 nm when the same 10 × 10 fibers are arranged contiguously as a single source.
Figure 8.
Figure 8.
Signaling properties of coarse versus fine nitrergic plexus morphologies with random fiber distributions. A, An example of multiple nitrergic plexuses is found in the ocellar neuropil of the locust. Fine fibers arborize in a pseudorandom manner. Scale bar, 10 μm. B, C, NO signals generated by a finer plexus are less dependent on the details of the random plexus morphology, more homogeneous, and more centered relative to the synthesizing volume. Populations of model plexuses (n = 30) composed of 1- μm-diameter fibers (B) or 5- μm-diameter fibers (C) were grown by a random branching algorithm, yielding the same overall source density within a synthesizing region of 100 × 100 × 100 μm3. Three instances of each population are shown schematically in Bi, Ci (synthesizing region indicated by dashed gray outlines). Bii, Cii, After 1 s of NO synthesis, the frequency distribution of the NO concentrations encountered in the center is much narrower across the population of fine plexuses. This indicates greater independence from the morphological details of the plexus and greater homogeneity of the concentration distribution across the synthesizing volume. Biii, Ciii, Compare the concentration profiles across the center of random plexuses (fine gray lines; n = 30) with that across a homogeneous spherical source (heavy black line). The spherical source has the same overall source strength as each plexus and occupies the same volume as the synthesizing region within which the plexuses were grown. The signals from fine plexuses (Biii) approximate much more closely that of a homogeneous source than those generated by coarse plexuses (Ciii). Moreover, with finer plexus morphologies, the NO cloud is better centered over the synthesizing region. This is shown schematically in Bi and Ci by gray circles, indicating the clouds, and quantitatively in D by plotting the center-of-mass positions of the clouds across populations of fine (circles) and coarse (crosses) plexuses on a slice through the center of the synthesizing region.

Similar articles

Cited by

References

    1. Ames W (1992) Numerical methods for partial differential equations, Ed 3. Boston: Academic.
    1. Artz JD, Toader V, Zavorin SI, Bennett BM, Thatcher GR (2001) In vitro activation of soluble guanylyl cyclase and nitric oxide release: comparison of NO donors and NO mimetics. Biochemistry 40: 9256-9264. - PubMed
    1. Bellamy TC, Griffiths C, Garthwaite J (2002) Differential sensitivity of guanylyl cyclase and mitochondrial respiration to nitric oxide measured using clamped concentrations. J Biol Chem 277: 31801-31807. - PubMed
    1. Blute TA, Lee MR, Eldred WD (2000) Direct imaging of nMDA-stimulated nitric oxide production in the retina. Vis Neurosci 17: 557-566. - PubMed
    1. Bon CL, Garthwaite J (2001) Exogenous nitric oxide causes potentiation of hippocampal synaptic transmission during low-frequency stimulation via the endogenous nitric oxide-cGMP pathway. Eur J Neurosci 14: 585-594. - PubMed

Publication types

LinkOut - more resources