. 2005 Aug;79(15):9597-607.
doi: 10.1128/JVI.79.15.9597-9607.2005.

Two Sp1/Sp3 binding sites in the major immediate-early proximal enhancer of human cytomegalovirus have a significant role in viral replication

Affiliations

Two Sp1/Sp3 binding sites in the major immediate-early proximal enhancer of human cytomegalovirus have a significant role in viral replication

Hiroki Isomura et al. J Virol. 2005 Aug.

Abstract

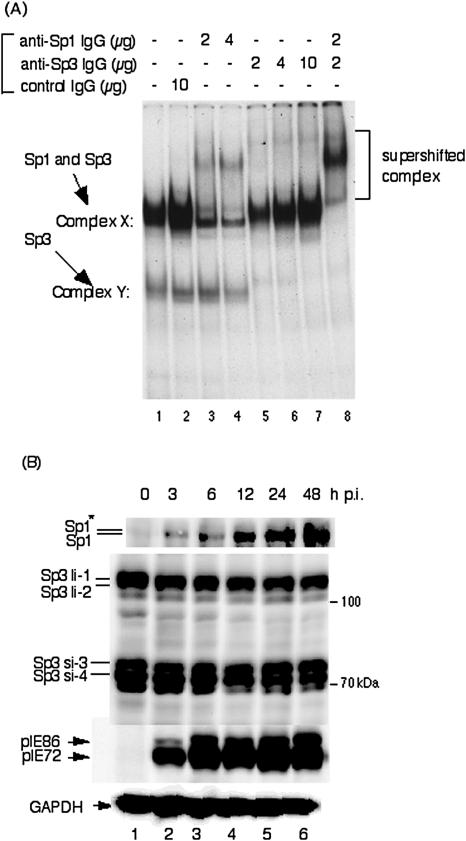
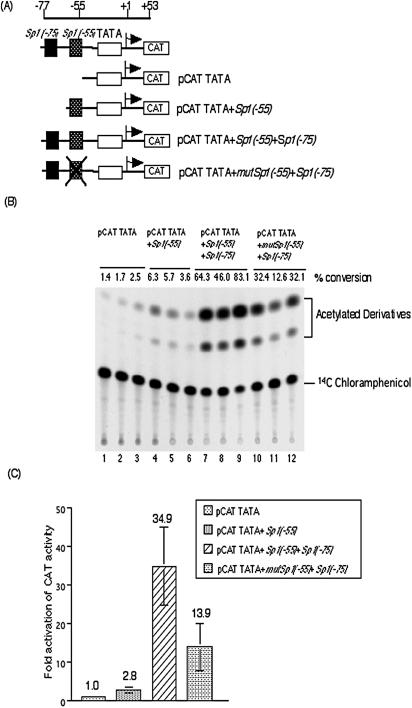
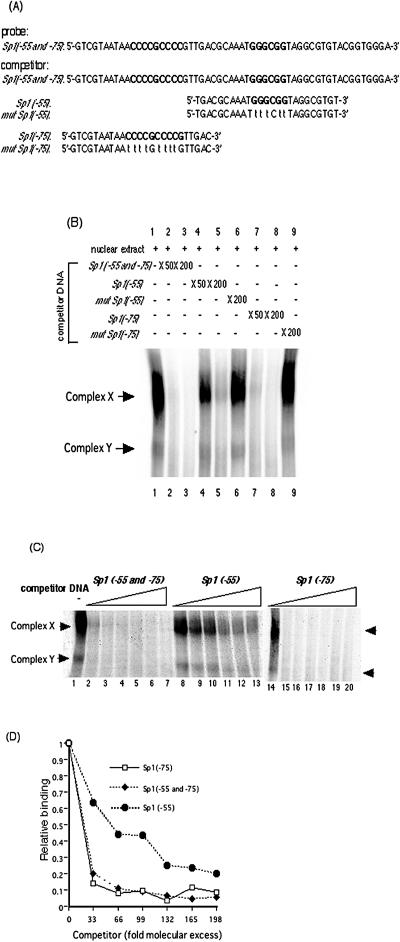
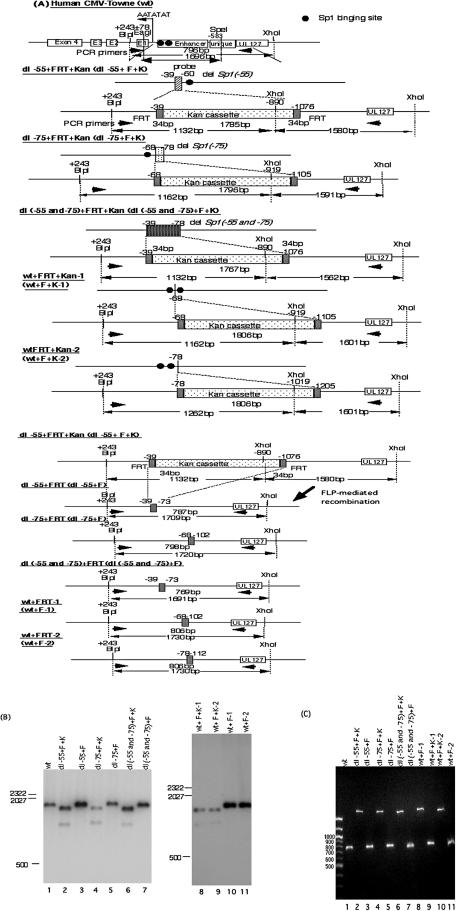
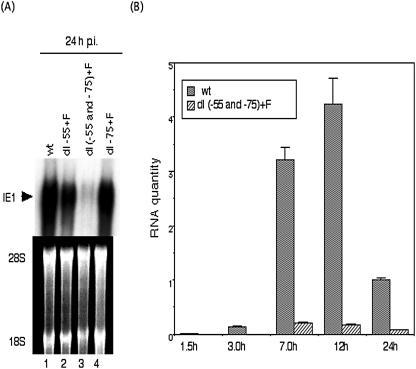
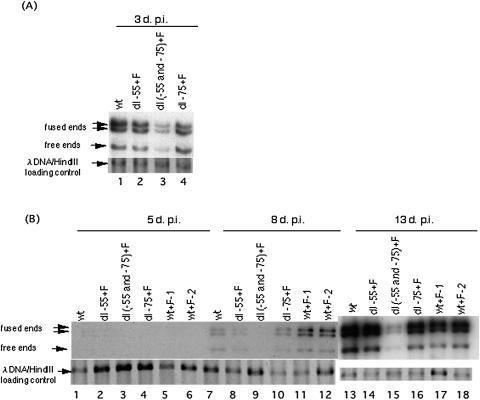
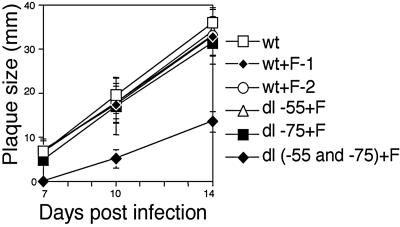
We previously demonstrated that the major immediate early (MIE) proximal enhancer containing one GC box and the TATA box containing promoter are minimal elements required for transcription and viral replication in human fibroblast cells (H. Isomura, T. Tsurumi, M. F. Stinski, J. Virol. 78:12788-12799, 2004). After infection, the level of Sp1 increased while Sp3 remained constant. Here we report that either Sp1 or Sp3 transcription factors bind to the GC boxes located at approximately positions -55 and -75 relative to the transcription start site (+1). Both the Sp1 and Sp3 binding sites have a positive and synergistic effect on the human cytomegalovirus (HCMV) major immediate-early (MIE) promoter. There was little to no change in MIE transcription or viral replication for recombinant viruses with one or the other Sp1 or Sp3 binding site mutated. In contrast, mutation of both the Sp1 and Sp3 binding sites caused inefficient MIE transcription and viral replication. These data indicate that the Sp1 and Sp3 binding sites have a significant role in HCMV replication in human fibroblast cells.


Figures

FIG. 1.
FIG. 1.
Sp1 and Sp3 transcription factors bind to GC boxes located in the proximal enhancer of HCMV MIE genes. (A) Supershift assay of DNA-protein complexes with anti-Sp1 and/or anti-Sp3 antibodies plus nuclear extracts using the 32P-labeled Sp1(−75) as a probe. Lane 1, probe plus nuclear extract; lane 2, probe plus nuclear extract with 10 μg of rabbit control IgG; lanes 3 and 4, probe plus nuclear extract with 2 and 4 μg of anti-Sp1 antibody, respectively; lanes 5, 6, and 7, probe plus nuclear extract with 2, 4, and 10 μg of anti-Sp3 antibody, respectively; lane 8, probe plus nuclear extract with 2 μg of anti-Sp1 and anti-Sp3 antibodies. Similar results were obtained using 32P-labeled Sp1(−55) as a probe.(B) Expression levels of Sp1 and Sp3 transcription factors after infection with HCMV. HFF cells were infected with HCMV at an MOI of 3 and harvested at the indicated times. Protein samples were prepared and 20 μg of each protein was applied for Western blot analyses. Proteins were separated by using 10% SDS-polyacrylamide gels. Detection of Sp1, Sp3, and immediate-early pIE72 (UL123)/pIE86 (UL122) was performed with polyclonal antibodies sc-59 and sc-644 and monoclonal antibody NEA-9221, respectively. Anti-pGAPDH antibody was used to confirm equal protein loading. For Sp1 the asterisk indicates the phosphorylated form. Abbreviations: Sp3li-1 and -2, long isoforms of Sp3; Sp3si-3 and -4, small isoforms of Sp3. The time p.i. is given at the top of each lane.
FIG. 2.
FIG. 2.
Sp1/Sp3 binding sites in the proximal enhancer have positive and synergistic effects on MIE promoter activity. (A) Schematic representation of the structures of the CAT gene constructs. (B) HFF cells were transfected with each plasmid and harvested at 72 h. CAT assays were performed as described in Materials and Methods. Experiments were performed in triplicate. Values represent percent conversion from unacetylated chloramphenicol to the acetylated form. (C) The increase in activation (n-fold) of CAT activity relative to that for pCAT TATA was determined and plotted on the graph. Data represent averages from three independent experiments.
FIG. 3.
FIG. 3.
Binding activity of Sp1/Sp3 transcription factors to Sp1(−75) and to Sp1(−55). (A) DNA sequences of 32P-labeled probe containing both Sp1(−55) and Sp1(−75) and competitor dsDNAs containing Sp1(−55 and75), Sp1(−55), mutated Sp1(−55), Sp1(−75), or mutated Sp1(−75). The probe and the competitor dsDNAs were generated as described in Materials and Methods. (B) Autoradiogram of competitive EMSA. Competitive EMSAs were performed using 32P-labeled Sp1(−55 and75) containing both GC boxes as a probe and the indicated excess of each competitor dsDNA as described in Materials and Methods. Lanes contain the following: probe plus nuclear extract (lane 1), probe plus nuclear extract in the presence of a 50- or 200-fold molar excess of Sp1(−55 and −75) DNA (lanes 2 and 3, respectively), probe plus nuclear extract in the presence of a 50- or 200-fold molar excess of nonradioactive Sp1(−55) DNA (lanes 4 and 5, respectively), probe plus nuclear extract in the presence of a 200-fold molar excess of nonradioactive mutated Sp1(−55) DNA (lane 6), probe plus nuclear extract in the presence of a 50- or 200-fold molar excess of nonradioactive Sp1(−75) DNA (lanes 7 and 8, respectively), probe plus nuclear extract in the presence of a 200-fold molar excess of nonradioactive mutated Sp1(−75) DNA (lane 9). (C) Binding affinity of the transcription factors for Sp1(−55) and Sp1(−75) examined quantitatively by competitive EMSA. The probe for Sp1(−55 and75) was incubated with nuclear extracts in the absence or presence of increasing concentrations (33-, 66-, 99-, 132-, 165-, and 198-fold molar excesses) of Sp1(−55 and75), Sp1(−55), or Sp1(−75) nonradioactive competitor DNA. Lanes contain the following: probe in the absence of competitor DNA (lanes 1 and 14), 33-fold molar excess of competitor DNA (lanes 2, 8, and 15), 66-fold molar excess of competitor DNA (lanes 3, 9, and 16), 99-fold molar excess of competitor DNA (lanes 4, 10, and 17), 132-fold molar excess of competitor DNA (lanes 5, 11, and 18), 165-fold molar excess of competitor DNA (lanes 6, 12, and 19),and 198-fold molar excess of competitor DNA (lanes 7, 13, and 20). (D) Quantification of complex X and Y formation shown in panel C. Intensities were assessed with a BAS2500 (Fuji) image analyzer as described in Materials and Methods. The results are expressed as ratios of binding in the absence of competitor DNA.
FIG. 4.
FIG. 4.
Structural analyses of recombinant HCMV BAC DNAs. (A) Schematic illustrations of parental and recombinant BAC DNAs with and without the Kanr gene. All recombinant BAC DNAs were constructed using a PCR-based rapid recombination system, and the Kanr gene was excised as described in Materials and Methods. The viral DNA fragment sizes of all recombinant viruses digested with restriction endonucleases BlpI and XhoI are indicated. Southern blot hybridization was performed with the 32P-labeled probe designated in the diagram for the human CMV Towne strain (wt). PCR was performed using primers designated in the diagram. (B) Southern blot analysis of the parental (wt) and dl−55+F, dl−75+F, dl(−55 and −75)+F, wt+F-1, and wt+F-2 recombinant BAC DNAs, with and without Kanr. Viral DNAs were digested with restriction endonucleases BlpI and XhoI, fractionated by electrophoresis in 1.0% agarose gels, and subjected to hybridization with the 32P-labeled probe. Standard molecular size markers are indicated in base pairs. BAC DNAs are identified at the tops of the blots. (C) PCR analysis of the parental and recombinant BAC DNAs. The products were amplified using the primer pair shown in panel A and fractionated by electrophoresis in 1.0% agarose and stained with ethidium bromide. BAC DNAs are identified at the top of the blot.
FIG. 5.
FIG. 5.
Viral MIE gene transcription with the wt and recombinant viruses. (A) Steady-state IE1 mRNA levels at 24 h p.i. were analyzed with an IE1 probe by Northern blotting as described in Materials and Methods. 28S and 18S ribosomal RNAs served as controls for equal amounts of RNA loading. (B) Kinetics of MIE gene transcription for the wt and dl(−55 and −75)+F recombinant viruses, assayed by real-time PCR. HFF cells were infected with the wt or dl(−55 and −75)+F recombinant virus at an MOI of 3. Total RNAs were purified in parallel at 1.5, 3.0, 7.0, 12, and 24 h p.i., and levels of IE1 and IE2 transcripts were analyzed by real-time PCR as described in Materials and Methods. Values were calculated relative to the level of the wt transcripts at 24 h.p.i. Data are averages of three independent experiments.
FIG. 6.
FIG. 6.
Effect of deletion of the two Sp1/Sp3 binding sites on viral DNA replication at high and low MOIs. (A) HFF cells were infected with wt or dl-55+F, dl-75+F, or dl(−55 and −75)+F recombinant viruses at an MOI of 3 and harvested 3 days p.i. DNAs purified from cells were digested with restriction endonuclease HindIII and subjected to Southern blot hybridization with the 32P-labeled T probe as described in Materials and Methods. Arrows designate the viral DNA fused ends 17.2- and 13.0-kbp, free ends 9.7-kbp, and internal lambda DNA control. (B) HFF cells were infected with wt or wt+F-1, wt+F-2, dl-55+F, dl-75+F or dl(−55 and −75)+F recombinant viruses at an MOI of 0.01 and harvested 5, 8, and 13 days p.i. DNAs purified from cells were digested with HindIII and subjected to Southern blot hybridization with the 32P-labeled T probe.
FIG. 7.
FIG. 7.
Plaque formation after infection with recombinant virus having both Sp1/Sp3 binding sites deleted. All plaques were generated from inocula infected with wt or wt+F-1, wt+F-2, dl-55+F, dl-75+F or dl(−55 and −75)+F recombinant viruses at an MOI of 0.01 in HFF cells. Each plaque size was determined as a mean of minimum and maximum lengths at the indicated days after infection. The results are averages for 10 plaques.

Similar articles

Cited by

References

    1. Aoyama, T., T. Okamoto, S. Nagayama, K. Nishijo, T. Ishibe, K. Yasura, T. Nakayama, T. Nakamura, and J. Toguchida. 2004. Methylation in the core-promoter region of the chondromodulin-I gene determines the cell-specific expression by regulating the binding of transcriptional activator Sp3. J. Biol. Chem. 279:28789-28797. - PubMed
    1. Apt, D., R. M. Watts, G. Suske, and H. U. Bernard. 1996. High Sp1/Sp3 ratios in epithelial cells during epithelial differentiation and cellular transformation correlate with the activation of the HPV-16 promoter. Virology 224:281-291. - PubMed
    1. Baldick, C. J., A. Marchini, C. E. Patterson, and T. Shenk. 1997. Human cytomegalovirus tegument protein pp71 (ppUL82) enhances the infectivity of viral DNA and accelerates the infectious cycle. J. Virol. 71:4400-4408. - PMC - PubMed
    1. Benedict, C. A., A. Angulo, G. Patterson, S. Ha, H. Huang, M. Messerle, C. F. Ware, and P. Ghazal. 2004. Neutrality of the canonical NF-κB-dependent pathway for human and murine cytomegalovirus transcription and replication in vitro. J. Virol. 78:741-750. - PMC - PubMed
    1. Boekhoudt, G. H., Z. Guo, G. W. Beresford, and J. M. Boss. 2003. Communication between NF-κB and Sp1 controls histone acetylation within the proximal promoter of the monocyte chemoattractant protein 1 gene. J. Immunol. 170:4139-4147. - PubMed

Publication types

Substances

LinkOut - more resources