. 2005 Aug;79(15):10053-8.
doi: 10.1128/JVI.79.15.10053-10058.2005.

Nef induces multiple genes involved in cholesterol synthesis and uptake in human immunodeficiency virus type 1-infected T cells

Affiliations

Nef induces multiple genes involved in cholesterol synthesis and uptake in human immunodeficiency virus type 1-infected T cells

Angélique B van 't Wout et al. J Virol. 2005 Aug.

Abstract

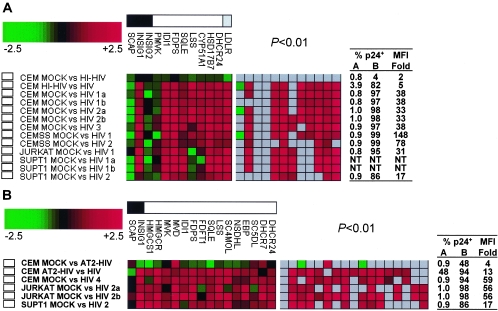
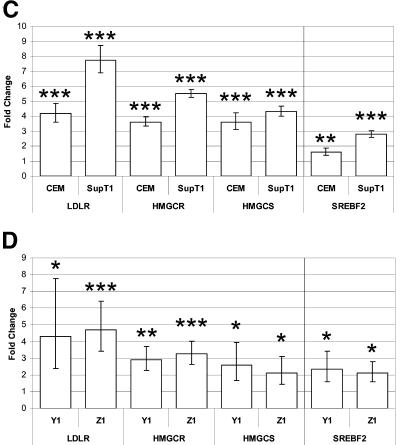
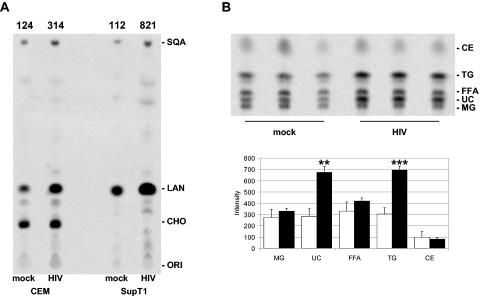
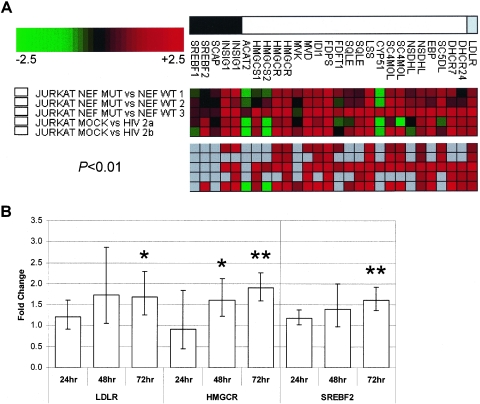
Several recent reports indicate that cholesterol might play an important role in human immunodeficiency virus type 1 (HIV-1) replication. We investigated the effects of HIV-1 infection on cholesterol biosynthesis and uptake using microarrays. HIV-1 increased gene expression of cholesterol genes in both transformed T-cell lines and primary CD4(+) T cells. Consistent with our microarray data, (14)C-labeled mevalonate and acetate incorporation was increased in HIV-1-infected cells. Our data also demonstrate that changes in cholesterol biosynthesis and uptake are only observed in the presence of functional Nef, suggesting that increased cholesterol synthesis may contribute to Nef-mediated enhancement of virion infectivity and viral replication.


Figures

FIG. 1.
FIG. 1.
HIV-1 infection alters transcripts involved in cholesterol biosynthesis and uptake. Changes in expression of SREBF-2-regulated transcripts were determined using microarrays (A and B) or real-time reverse transcription-PCR (C and D). (A and B) Expression of SREBF-2-regulated transcripts was determined using in-house microarrays representing ≈4,500 unique human genes (A), or commercial microarrays representing ≈15,000 unique human genes (B). Gene groupings are indicated in the bar at the top of each panel for sterol biosynthesis regulators (black box), enzymes (white box) and the LDL receptor (grey box). Shown in color code below these bars are fold changes in mRNA levels in 24-h HIV-1LAI-infected CD4+ T-cell lines compared with mock-infected cells. Numbers 1 to 4 in the experiment name denote biological replicates, while letters a and b denote technical replicates. Ratios of change in mRNA levels in infected cells versus controls are depicted as green (down-regulated) or red (up-regulated) boxes. Left panels show all ratios, and the right panel shows box colors only for those ratios with P values of <0.01. The tables on the right of the panels depict the percentage of p24gag-expressing cells in controls (column A) and infected cells (column B) and the fold increase in median fluorescence intensity (MFI) for each of the conditions being compared in the corresponding microarray experiment. Heat-inactivated (HI-HIV) and chemically inactivated HIV-1 (AT2-HIV) were compared to both mock and infectious HIV-1 in separate experiments. (C and D) Expression of SREBF-2 and 3 SREBF-2-regulated transcripts in HIV-1-infected CD4+ T-cell lines (C) and primary CD4+ T cells (D) as determined by real-time reverse transcription-PCR (N = 2 to 5). Results were normalized by subtracting β-actin cycle threshold (Ct) values measured in the same samples from the experimental gene Ct values, resulting in normalized Δ Ct values for each mock or infected sample. Differences between corresponding mock and infected samples were expressed as ΔΔ Ct, subtracting Δ Ct (infected) from Δ Ct (mock). As each Ct difference corresponds to a twofold change in mRNA levels, this was translated to the fold changes depicted in the graph using 2ΔΔCt. Each sample was tested in triplicate (mean and standard deviation are depicted). P values: *, <0.05; **, <0.01; ***, <0.001.
FIG. 1.
FIG. 1.
HIV-1 infection alters transcripts involved in cholesterol biosynthesis and uptake. Changes in expression of SREBF-2-regulated transcripts were determined using microarrays (A and B) or real-time reverse transcription-PCR (C and D). (A and B) Expression of SREBF-2-regulated transcripts was determined using in-house microarrays representing ≈4,500 unique human genes (A), or commercial microarrays representing ≈15,000 unique human genes (B). Gene groupings are indicated in the bar at the top of each panel for sterol biosynthesis regulators (black box), enzymes (white box) and the LDL receptor (grey box). Shown in color code below these bars are fold changes in mRNA levels in 24-h HIV-1LAI-infected CD4+ T-cell lines compared with mock-infected cells. Numbers 1 to 4 in the experiment name denote biological replicates, while letters a and b denote technical replicates. Ratios of change in mRNA levels in infected cells versus controls are depicted as green (down-regulated) or red (up-regulated) boxes. Left panels show all ratios, and the right panel shows box colors only for those ratios with P values of <0.01. The tables on the right of the panels depict the percentage of p24gag-expressing cells in controls (column A) and infected cells (column B) and the fold increase in median fluorescence intensity (MFI) for each of the conditions being compared in the corresponding microarray experiment. Heat-inactivated (HI-HIV) and chemically inactivated HIV-1 (AT2-HIV) were compared to both mock and infectious HIV-1 in separate experiments. (C and D) Expression of SREBF-2 and 3 SREBF-2-regulated transcripts in HIV-1-infected CD4+ T-cell lines (C) and primary CD4+ T cells (D) as determined by real-time reverse transcription-PCR (N = 2 to 5). Results were normalized by subtracting β-actin cycle threshold (Ct) values measured in the same samples from the experimental gene Ct values, resulting in normalized Δ Ct values for each mock or infected sample. Differences between corresponding mock and infected samples were expressed as ΔΔ Ct, subtracting Δ Ct (infected) from Δ Ct (mock). As each Ct difference corresponds to a twofold change in mRNA levels, this was translated to the fold changes depicted in the graph using 2ΔΔCt. Each sample was tested in triplicate (mean and standard deviation are depicted). P values: *, <0.05; **, <0.01; ***, <0.001.
FIG. 2.
FIG. 2.
HIV-1 infection increases 14C-labeled mevalonate and acetate incorporation. Cells were mock or HIV-1LAI infected for 24 h before addition of 14C-labeled mevalonate (A) or 14C-labeled acetate (B). After 6 or 2 h, respectively, cells were harvested, and lipids were extracted and separated using thin-layer chromatography. (A) Mevalonate results are representative of three separate experiments using CCRF-CEM, CEMss, Jurkat, or SupT1 cells. Numbers above the image denote signal intensity. Note that CYP51 mRNA expression was not detected in SupT1 cells and as a result no 14C-labeled cholesterol was produced. (B) Signal intensities for acetate labeling of mock-infected (open bars) or HIV-1-infected (solid bars) CEM cells are plotted in the graph below the image. The mean and standard deviation for the triplicate experiments are shown. Individual products were identified by comparison of the observed Rf factor with those of known sterols. ORI, origin; CHO, cholesterol; LAN, lanosterol; SQA, squalene; MG, monoglycerides; UC, free cholesterol; FFA, free fatty acids; TG, triglycerides; CE, cholesterol esters. P values: **, <0.01; ***, <0.001.
FIG. 3.
FIG. 3.
HIV-1 Nef induces multiple genes involved in cholesterol biosynthesis and uptake. (A) Gene expression profiles of Jurkat T cells transduced with vesicular stomatitis virus G-pseudotyped HIV-1NL4-3 IRES-eGFP replication-competent reporter viruses containing nef-intact (WT) or nef-defective (MUT) reading frames or infected with HIV-1LAI or mock infected. Shown are fold changes in mRNA levels for sterol biosynthesis regulators (black box), enzymes (white box), and the LDL receptor (grey box). Ratios of change in mRNA levels in infected versus controls or wild-type versus mutant are depicted as green (down-regulated), red (up-regulated), or grey (not significantly changed at P < 0.01). The top panel shows all ratios irrespective of significance, whereas the bottom panel shows only those ratios with P values of < 0.01. Results for three independent transductions are shown. (B) Real-time reverse transcription-PCR analysis of SREBF-2 and SREBF-2-regulated transcripts in wild-type nef versus mutant nef at 24, 48, and 72 h postinfection (N = 2). Fold changes were determined as in Fig. 1. Each sample was tested in triplicate (mean and standard deviation are depicted). P values: *, <0.05; **, <0.01.

Similar articles

Cited by

References

    1. Aloia, R. C., H. Tian, and F. C. Jensen. 1993. Lipid composition and fluidity of the human immunodeficiency virus envelope and host cell plasma membranes. Proc. Natl. Acad. Sci. USA 90:5181-5185. - PMC - PubMed
    1. Chazal, N., and D. Gerlier. 2003. Virus entry, assembly, budding, and membrane rafts. Microbiol. Mol. Biol. Rev. 67:226-237. - PMC - PubMed
    1. del Real, G., S. Jimenez-Baranda, E. Mira, R. A. Lacalle, P. Lucas, C. Gomez-Mouton, M. Alegret, J. M. Pena, M. Rodriguez-Zapata, M. Alvarez-Mon, A. C. Martinez, and S. Manes. 2004. Statins inhibit HIV-1 infection by down-regulating Rho activity. J. Exp. Med. 200:541-547. - PMC - PubMed
    1. Ding, L., A. Derdowski, J. J. Wang, and P. Spearman. 2003. Independent segregation of human immunodeficiency virus type 1 Gag protein complexes and lipid rafts. J. Virol. 77:1916-1926. - PMC - PubMed
    1. Folch, J., M. Lees, and G. H. Sloane Stanley. 1957. A simple method for the isolation and purification of total lipides from animal tissues. J. Biol. Chem. 226:497-509. - PubMed

Publication types