. 2005 Aug;79(15):10083-7.
doi: 10.1128/JVI.79.15.10083-10087.2005.

The severe acute respiratory syndrome coronavirus 3a protein up-regulates expression of fibrinogen in lung epithelial cells

Affiliations

The severe acute respiratory syndrome coronavirus 3a protein up-regulates expression of fibrinogen in lung epithelial cells

Yee-Joo Tan et al. J Virol. 2005 Aug.

Abstract

Here we analyzed the gene expression profile of cells that stably express the severe acute respiratory syndrome coronavirus (SARS-CoV) 3a protein to determine its effects on host functions. A lung epithelial cell-line, A549, was chosen for this study because the lung is the primary organ infected by SARS-CoV and fatalities resulted mainly from pulmonary complications. Our results showed that the expression of 3a up-regulates the mRNA levels of all three subunits, Aalpha, Bbeta, and gamma, of fibrinogen. Consequently, the intracellular levels as well as the secretion of fibrinogen were increased. We also observed increased fibrinogen levels in SARS-CoV-infected Vero E6 cells.


Figures

FIG. 1.
FIG. 1.
Stable expression of SARS-CoV 3a in A549, a lung epithelial cell line, and effects on the mRNA levels of fibrinogen Aα, Bβ, and γ subunits and fibrinogen-related proteins. (A) Western analysis showing the expression of 3a in the stable cell lines clones U1 and U2 but not in the vector control (VEC) cells (top panel). An unknown cellular protein cross-reacting with the anti-3a mouse polyclonal is marked with an asterisk. Equal amounts of cells were used in each lane as verified by the level of endogenous actin (bottom panel). (B) Reverse transcription-PCR results showing the higher mRNA levels of fibrinogen subunits Aα, Bβ, and γ in clones U1 and U2 compared to the vector control. The mRNA level of fibrinogen-like 1, a member of the fibrinogen superfamily, was also increased in the presence of 3a. The primers used (5′ to 3′) were A1: TCACTGAATCTAACCATAGCTGACC (sense) and A2: AAGGCAAGACCACCAGGATTAAAGA (antisense) for probe set ID205649_s_at; A3: TTCGACACTGCCTCAACTGGAAAAA (sense) and A4: GGGCGAGATTTAGCATGGCCTCTCT (antisense) for probe set ID205650_s_at; B1: GTCATGCAGCCAATCCAAACGGCAG (sense) and B2: CGACAAGGATAAAAGACCCCTCTTC (antisense) for probe set ID204988_at; B3: GGTCATCGACCCCTTGACAAGAAGA (sense) and B4: GCATGGGGTGCGACAATATTCCATT (antisense) for probe set ID216238_s_at; G1: CTTCGCTGGTGGGGATGCTGGAGAT (sense) and G2: CATAACCATTAGGAGTAGATGCTTT (antisense) for probe set ID219612_s_at; and L1: CAGCTGGAGATTCCCTTGCGGGGAA (sense) and L2: ATTAAGTAACAAAGGCAAGTGAGAA (antisense) for probe set ID205305_at. The level of glyceraldehyde-3-phosphate dehydrogenase (GAPDH) mRNA was used to verify that equal amounts of RNA were used in each reaction, and the primers used were GAPDHfor: CTGAGAACGGGAAGCTTGTCATCA (sense) and GAPDHrev: CGTCTAGCTCAGGGATGACCTTG (antisense).
FIG. 2.
FIG. 2.
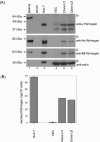
Effects of SARS-CoV 3a protein on the intracellular level of fibrinogen subunits and the secretion of fibrinogen complex into culture supernatant. (A) Western blot analysis with specific monoclonal antibodies was used to detect the Aα, Bβ, and γ subunits of fibrinogen in human plasma (lane 1) and Huh7 cells (lane 3), a human liver cell line that constitutively expresses fibrinogen. Lane 2 was loaded with a similar amount of human serum as a negative control and for all three antibodies did not cross-react with proteins present in human serum. The intracellular levels of the Aα, Bβ, and γ subunits of fibrinogen were higher in the 3a-expressing clones (U1 and U2) compared to the vector control cells (VEC) (panels a to c). Equal loadings of cell lysates was verified by the level of endogenous actin (panel d). (B) The amounts of fibrinogen secreted into the cell culture supernatants, as determined by an ELISA, were higher for the 3a-expressing stable clones U1 and U2 compared to the vector control cells (VEC) (columns 2 to 4). The amount of fibrinogen secreted by Huh7 cells was also determined (column 1). This experiment was repeated three times, and similar results were obtained each time. A representative set of data (mean ± standard deviation) is presented.
FIG. 3.
FIG. 3.
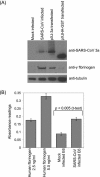
Changes in the intracellular level of fibrinogen γ subunit and secretion of fibrinogen complex into culture supernatant of Vero E6 cells infected with SARS-CoV. (A) Mock- and SARS-CoV-infected Vero E6 cells (lanes 1 and 2, respectively) were subjected to Western blot analysis with the anti-3a polyclonal to determine the expression level of 3a (first panel). Vero E6 cells transiently expressing 3a or a control protein, hemagglutinin (HA)-glutathione S-transferase (GST), was similarly analyzed (lanes 3 and 4, first panel). Since the anti-3a antibody was obtained using a GST fusion protein, it recognizes both the 3a and GST proteins. Monoclonal antibody against fibrinogen γ subunit was used to determine the intracellular level of this protein (second panel). The level of endogenous tubulin was used to compare the amount of total cell lysates used (third panel). (B) The amount of fibrinogen secreted by mock- and SARS-CoV-infected cells into the cell culture supernatants was determined using an ELISA for measuring human fibrinogen. Vero E6 cells were infected at a multiplicity of infection of 0.1 for 2 h and then replaced with the unsupplemented medium. At approximately 14 h postinfection, the cells showed approximately 50% cytopathic effect, and the culture supernatants were collected. Determination of the exact concentration of fibrinogen secreted by Vero E6 cells was not possible as no standard for fibrinogen from African green monkeys was available. Two independent infection experiments were performed, and for each sample, two readings were obtained, and the data were subjected to paired two-sample Student t tests for means (Excel, Microsoft) to determine if the difference in fibrinogen secreted from mock- and SARS-CoV-infected cells was significant (n = 4, two-tailed, P = 0.003). Data represent mean ± standard deviation. The absorbance readings for human fibrinogen standards are shown for comparison.

Similar articles

Cited by

References

    1. Bini, A., P. J. Simpson-Haidaris, and B. J. Kudryk. 2000. Fibrin/fibrinogen, p. 372. In A. Bikfalvi (ed.), Encyclopedic reference of vascular biology & pathology. Springer-Verlag, Berlin, Germany.
    1. Chong, P. Y., P. Chui, A. E. Ling, T. J. Franks, D. Y. Tai, Y. S. Leo, G. J. Kaw, G. Wansaicheong, K. P. Chan, L. L. Ean Oon, E. S. Teo, K. B. Tan, N. Nakajima, T. Sata, and W. D. Travis. 2004. Analysis of deaths during the severe acute respiratory syndrome (SARS) epidemic in Singapore: challenges in determining a SARS diagnosis. Arch. Pathol. Lab. Med. 128:195-204. - PubMed
    1. Clark, R. A. F. 1996. Wound repair, p. 617. In R. A. F. Clark (ed.), The molecular and cellular biology of wound repair. Plenum Press, New York, N.Y.
    1. Dowton, S. B., and H. R. Colten. 1988. Acute phase reactants in inflammation and infection. Semin. Hematol. 25:84-90. - PubMed
    1. Drosten, C., W. Preiser, S. Gunther, H. Schmitz, and H. W. Doerr. 2003. Severe acute respiratory syndrome: identification of the etiological agent. Trends Mol. Med. 9:325-327. - PMC - PubMed

Publication types

LinkOut - more resources