. 2005 Jul 15;309(5733):446-51.
doi: 10.1126/science.1108239.

Evidence for ectopic neurotransmission at a neuronal synapse

Affiliations

Evidence for ectopic neurotransmission at a neuronal synapse

Jay S Coggan et al. Science. .

Abstract

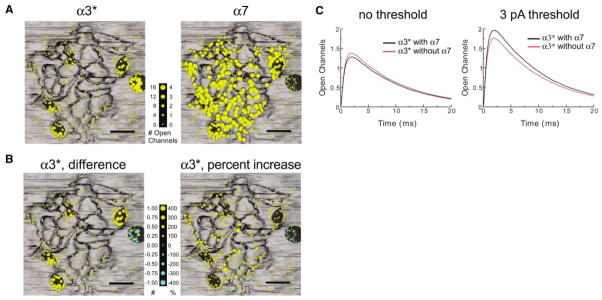
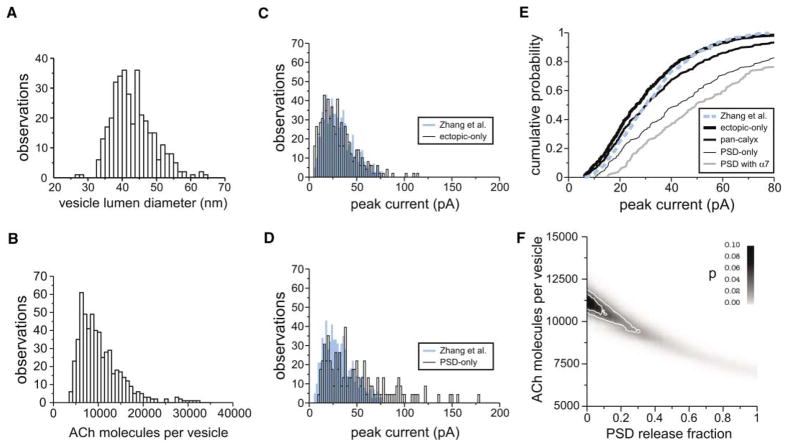
Neurotransmitter release is well known to occur at specialized synaptic regions that include presynaptic active zones and postsynaptic densities. At cholinergic synapses in the chick ciliary ganglion, however, membrane formations and physiological measurements suggest that release distant from postsynaptic densities can activate the predominantly extrasynaptic alpha7 nicotinic receptor subtype. We explored such ectopic neurotransmission with a novel model synapse that combines Monte Carlo simulations with high-resolution serial electron microscopic tomography. Simulated synaptic activity is consistent with experimental recordings of miniature excitatory postsynaptic currents only when ectopic transmission is included in the model, broadening the possibilities for mechanisms of neuronal communication.


Figures

Fig. 1
Fig. 1
3D model reconstruction. (A) Cross-sectional view about halfway through the middle of an E15 chick CG acquired with serial EM tomography and visualization software AnalyzeAVW. Several somatic spine cross sections are seen, along with vesicles packed in the presynaptic calyx. (B) Same panel as in (A), with presynaptic and postsynaptic membranes traced in cyan and red, respectively, using Xvoxtrace. Scale bar, 0.5 μm. (C) Serial section reconstruction after the surface is reconstructed with the marching cubes algorithm. The presynaptic membrane (cyan) overlies the postsynaptic membrane (red). (D) Viewed with DReAMM, the MCell compatible model, complete with all previously reported PSDs (shown as black circular regions) (4). Postsynaptic spine mat membrane is light blue; somatic membrane is gray. Area within white box is enlarged in next panel. (E) Close-up view of MCell compatible model. Yellow sphere represents synaptic vesicle. Green ovoids represent ACh molecules. Translucent blue squares and red circles represent α7- and α3*-nAChRs, respectively. Opacity of nAChR color corresponds to level of receptor activation (fully opaque = open channel) 200 μs after ACh release. Scale bar, 0.1 μm.
Fig. 2
Fig. 2
MCell output and location effects. (A) Time course of α3*- and α7- nAChR channel states after release of a single quantum. Green, double-bound closed (C2); black, double-bound open (O); red, single-bound (C1); blue, desensitized (C3, α7-nAChRs only). See (26) and fig. S2 for mechanisms and states. Scaling differences require presentation in two panels per receptor type (top and bottom). (B) Site map of selected release sites representing the greatest range of nAChR distributions. Vesicles are released at numbered yellow spheres indicated with white arrows; PSDs indicated by black-shaded patches; spine membrane, blue; somatic membrane, gray. Scale bar, 0.5 μm. (C) O-state responses (mean of 100 trials) from five sites in (B).
Fig. 3
Fig. 3
Model sensitivity. The effects of modulating the levels of four model components on O-state. (A) Effect of number of ACh molecules per quantum. Original condition, n = 5000 on O-state for α3*- and α7-nAChRs (fit: α3*, r = 0.999; α7, r = 0.998). (B) Effect of varying the K+ on O-state for α7- and α3*-nAChRs. Original values for α7-nAChR K+ = 4.1 × 10⁷ M−1s−1; for α3*-nAChR K+ = 2.3 × 10⁶ M−1s−1 (fit: α3*, r =0.999; α7, r = 0.987). (C) Effect of changing α3*- and α7-nAChR receptor density on O-state. Original value for both nAChRs was 3600/μm2 (fit: α3*, r = 0.992; α7, r = 0.986). (D) Effect of AChE density on O-state. Original AChE density in model was 3000/μm2 (fit: α3*, r = 0.997; α7, r = 0.995). All values in all panels are mean ± S.D., n = 100 per point. Arrows indicate original model values for each receptor type.
Fig. 4
Fig. 4
Simulated population mEPSC analysis. (A) Cumulative mean O-state α3*-nAChR - mediated mEPSC. Histograms of (B) mean number of peak open channels [bin = 0.075; same x-axis scale as (F) for comparison] (inset is the expanded full x-axis scale), (C) rise times (bin = 10), and (D) fall times (bin = 0.25). (E) Cumulative mean α7 - nAChR-mediated mEPSC (including 45 failures). Histograms of (F) open channels (bin = 0.076), (G) rise times (bin = 3), and (H) fall times (bin = 0.015).
Fig. 5
Fig. 5
Spatial mapping of mEPSCs and functional microdomain effects. (A) 550 vesicle sites with equal probability of release simulate a population of mEPSCs. Mean response (100 trials each) was mapped by the corresponding release location on the postsynaptic surface; vesicle radii (yellow spheres) are scaled to the open channel amplitude of the mEPSC. The maps are segregated for each type of nAChR (α3*-left, α7- right). (B) Maps of the difference in α3*-nAChR mEPSC amplitudes with and without α7-nAChRs (left panel), and the percent change in α3*-nAChR mEPSC amplitude without α7-nAChRs (right panel). Yellow, positive changes; cyan, negative changes. (C) Mean α3*-nAChR mEPSC responses in the presence (black trace) and absence (red trace) of α7-nAChRs before (left) and after (right) a 3-pA detection threshold (right).
Fig. 6
Fig. 6
Examination of ectopic release. (A) Frequency distribution of synaptic vesicle lumen diameters measured from tomographic reconstruction. (B) Vesicle size distribution adjusted volumetrically for ACh content. Mean number of ACh molecules (10,000) is that required to match the mean mEPSC amplitude from experimentally recorded events (11). (C) Population of mEPSCs from simulations with distributed vesicle sizes showing ectopic-only sites along with histogram of mEPSCs from CG whole-cell recordings (blue) (11). (D) Population of mEPSCs from simulations with distributed vesicle sizes showing PSD-only sites along with histogram of mEPSCs from CG whole-cell recordings (blue) (11). (E) Cumulative probability plots of mEPSCs from CG whole-cell recordings (dotted blue line) (11) and mEPSCs for simulated ectopic-only (thick black), pan-calyx (middle thickness black), PSD-only release (thin black), and PSD-only with α7-nAChRs (gray) populations. (F) Contour plot of goodness-of-fit between simulated and experimentally recorded mEPSCs. Distinct simulated mEPSC populations were generated by varying the fraction of vesicles released over PSD versus ectopic sites and by varying the mean number of ACh molecules per quantum. The fraction of PSD vesicles was varied from 0 (i.e., 0% PSD and 100% ectopic) to 1 (i.e., 100% PSD and 0% ectopic). The goodness-of-fit of each of these populations to the population of recorded mEPSCs (11) was measured by the Kolmogorov-Smirnov test. The P value of the goodness-of-fit is shown in grayscale. Darker gray indicates increasing similarity between the simulated and experimental populations. The outermost contour line indicates the P = 0.02 limit of confidence that the populations are dissimilar, and the inner line indicates the P = 0.05 limit.

Comment in

Similar articles

Cited by

References

    1. Zenisek D, Steyer JA, Almers W. Nature. 2000;406:849. - PubMed
    1. Lenzi D, Runyeon JW, Crum J, Ellisman MH, Roberts WM. J Neurosci. 1999;19:119. - PMC - PubMed
    1. Matsui K, Jahr CE. Neuron. 2003;40:1173. - PubMed
    1. Shoop RD, Martone ME, Yamada N, Ellisman MH, Berg DK. J Neurosci. 1999;19:692. - PMC - PubMed
    1. Shoop RD, Esquenazi E, Yamada N, Ellisman MH, Berg DK. J Neurosci. 2002;22:748. - PMC - PubMed

Publication types

MeSH terms