. 2006 Jan;13(1):20-30.
doi: 10.1038/sj.cdd.4401706.

Caspase-independent pathways of hair cell death induced by kanamycin in vivo

Affiliations

Caspase-independent pathways of hair cell death induced by kanamycin in vivo

H Jiang et al. Cell Death Differ. 2006 Jan.

Abstract

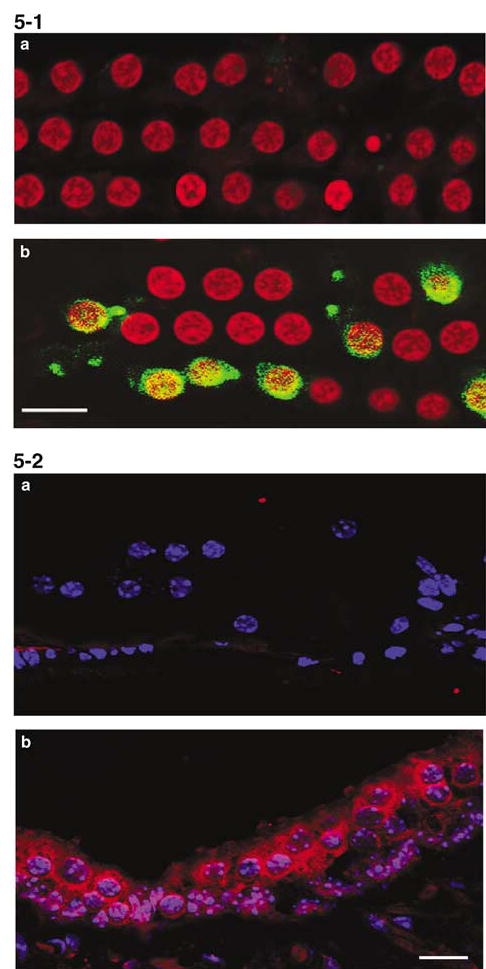
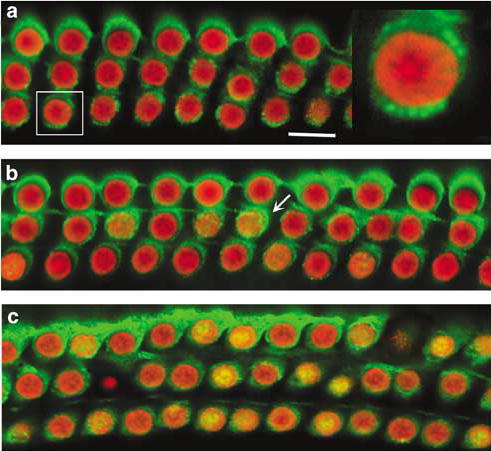
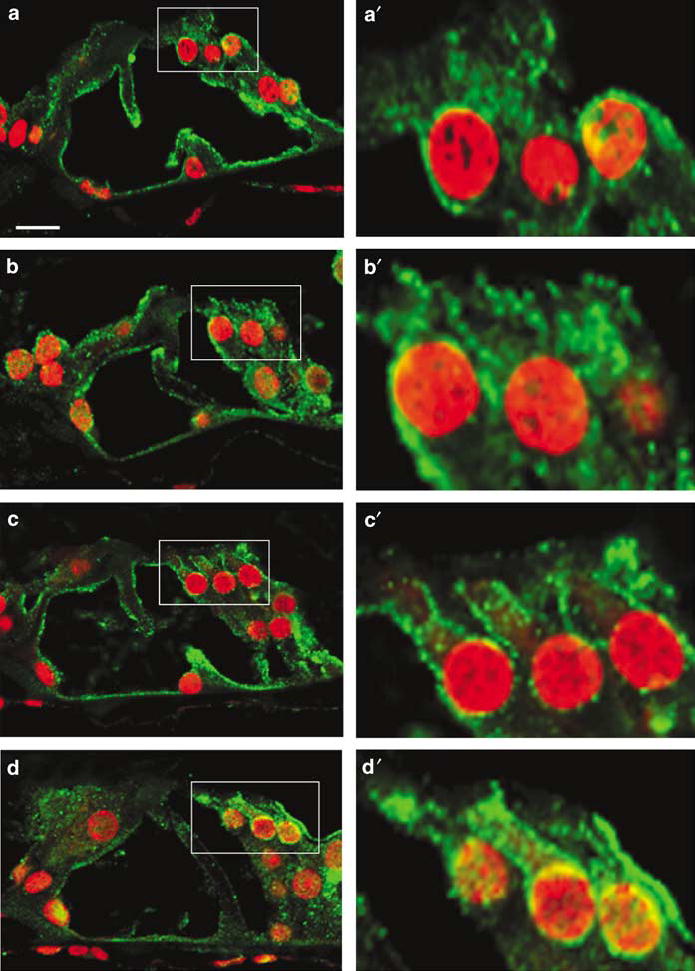
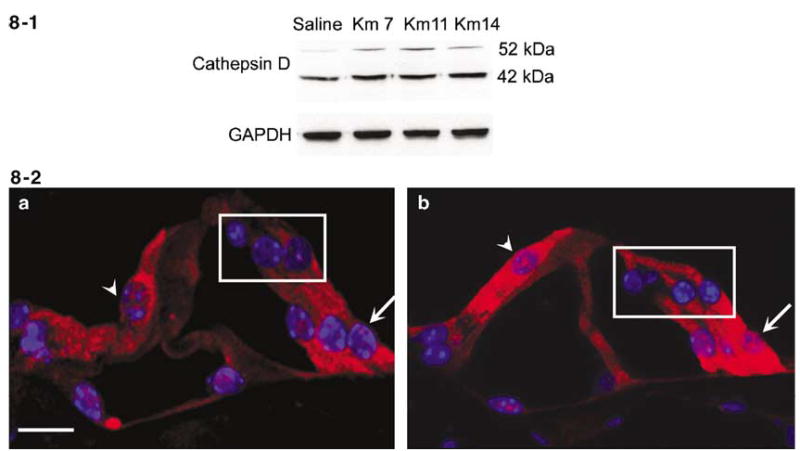
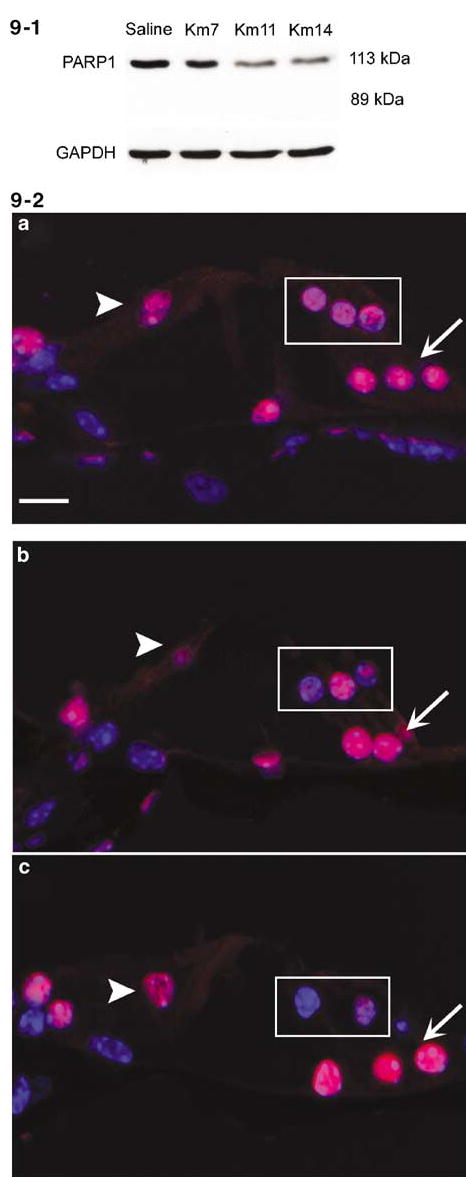
Cochlear and vestibular sensory cells undergo apoptosis when exposed to aminoglycoside antibiotics in organ culture, but mechanisms of chronic drug-induced hair cell loss in vivo are unclear. We investigated cell death pathways in a mouse model of progressive kanamycin-induced hair cell loss. Hair cell nuclei showed both apoptotic- and necrotic-like appearances but markers for classic apoptotic pathways (cytochrome c, caspase-9, caspase-3, JNK, TUNEL) were absent. In contrast, drug treatment caused EndoG translocation, activation of mu-calpain, and both the synthesis and activation of cathepsin D. Poly (ADP-ribose) polymerase 1 (PARP1) was decreased, but a caspase-derived 89 kDa PARP1 fragment was not present. The mRNA level of PARP1 remained unchanged. Thus, chronic administration of aminoglycosides causes multiple forms of cell death, without a major contribution by classic apoptosis. These results provide a better understanding of the toxic effects of aminoglycosides and are relevant to design protection from aminoglycoside-induced hearing loss.


Figures

Figure 1
Figure 1
Threshold shifts in mice treated with kanamycin. After 7 days of kanamycin treatment there was no significant change in ABR thresholds at 24 kHz, measured on day 7 (7 d/7 d). Continued injections of kanamycin for 14 days resulted in an increased threshold shift which stabilized around 50 dB at 5 W (14 d/5 W; n = 5 each, P<0.05)
Figure 2
Figure 2
Hair cell loss in the cochlea. a: In the saline-treated CBA mice, rhodamine phalloidin staining for actin showed the well-defined outline of outer hair cells. b: After treatment with kanamycin for 7 days there was no apparent loss of outer hair cells. c: After treatment with kanamycin for 11 days some outer hair cells had disappeared in the basal turn. d: After 14 days of treatment with kanamycin, about 30% of outer hair cells were lost in the basal turn. e: At 1 week after the end of a 14-day treatment, almost all outer hair cells in the basal turn had vanished. The figure is representative of three individual animals at each time point. Scale bar: 10 μm
Figure 3
Figure 3
Electron microscopic characterization of outer hair cell death. Ultrathin sections of mice cochlea at 11 days of treatment with saline (a) and kanamycin (b and c) were observed under electron microscopy. Nuclear morphology of outer hair cells in the basal turn of the saline group was normal (a, arrow); kanamycin treatment caused apoptotic-like cell death (b, arrow) indicated by incomplete and lumpy chromatin condensation as well as necrosis or necrotic-like cell death (c, arrow) indicated by cellular and nuclear swelling, and scattered chromatin condensation. This figure is representative of 2 individual animals for each condition. Scale bar: 10 μm
Figure 4
Figure 4
Nuclear morphology and TUNEL staining. Surface preparations of the organ of Corti in the basal turn were stained with TUNEL (green) and for nuclei with propidium iodide (red). a: Normal morphology and no TUNEL-positive staining was found in the outer hair cells in saline-treated control animals. b: After 7 days of kanamycin treatment the tissue appears normal. c: After 11 days of kanamycin treatment PI stained a number of cells with nuclear condensation (arrow) and swelling (arrow head), but only occasional cells were stained with TUNEL (green). d: At 14 days of kanamycin treatment loss of outer hair cells had increased. The sections shown are representative of six individual animals at each time point. In contrast, 3 h after noise exposure cochlear preparations consistently showed positive TUNEL stain (e: green). Scale bar: 10 μm
Figure 5
Figure 5
Activation of caspase-3 and JNK is not evident in the organ of Corti after kanamycin treatment. 5-1: Surface preparations of the organ of Corti were stained with active caspase-3 antibody (green) and propidium iodide (PI, red). a: Example of kanamycin treatment for 11 days. Caspase-3 immunoreactivity was not found at any of time points tested (during kanamycin treatment for 3, 7, 11 and 14 days as well as 3 days, 1 week, 2 weeks after the end of a 14-day treatment). Six animals were investigated at each time point, all without staining for caspase-3. b: In contrast, noise exposure produced a very strong signal 3 h after the end of exposure. Scale bar: 10 ím. 5-2: Sections from kanamycin-treated mice stained with phospho-JNK1/2 (red) and Heochest 33342 (blue). a: Organ of Corti after kanamycin treatment for 11 days. Phospho-JNK1/2 immunoreactivity showed negative results in the organ of Corti at all time points tested and in all six animals that were tested at each individual time point. b: Phospho-JNK1/2 immunoactivity was expressed in the saccule. Scale bar: 10 μm
Figure 6
Figure 6
Immunoreaction for EndoG in the cochlea. Surface preparations of the organ of Corti were stained for EndoG (green) and nuclei (PI, red). a: EndoG was located in the cytosol of outer hair cells in saline control animals, and EndoG-like immunoreactivity seemed to be limited to mitochondria (a right, magnified outer hair cell). b: At the 7th day of kanamycin treatment EndoG was still associated with mitochondria of most outer hair cells, but already appeared diffuse in a few cells (b, arrow). c: After kanamycin for 11 days, EndoG was translocated into the nuclei (c, yellow). This figure is representative of three individual animals at each time point. Scale bar: 10 μm
Figure 7
Figure 7
Activation of calpain in the cochlea. The sections were stained with μ-calpain antibody (green) and PI (red). a: In saline control animals, μ-calpain was localized in both the cytoplasm and cell membrane. b, c, d: Following kanamycin administration for 7 days (b), 11 days (c) and 14 days (d), μ-calpain was gradually translocated to the plasma membrane of outer hair cells. Right panels are high magnifications of outer hair cells (boxed) from each corresponding image. All sections were taken from the basal turn. This figure is representative of three individual animals at each time point. Scale bar: 10 μm
Figure 8
Figure 8
Kanamycin promotes expression and activation of cathepsin D in the organ of Corti. 8-1: Western blot analysis of cochlear extracts indicated that the precursor (52 kDa) and processed cathepsin D (42 kDa) were increased following kanamycin treatment for 7 days as well as for 11 and 14 days. Saline indicates saline-treated control animals; Km 7, Km 11 and Km 14 designate kanamycin treatment for 7, 11 and 14 days. GAPDH is a control for the loading amount of protein. This figure is representative of three individual experiments. 8-2: Immunocytochemical localization of cathepsin D. Cathepsin D is stained red, nuclei are blue with Hoechst-33342. a: Cathepsin D staining had a diffuse cytoplasmic localization in all cell types of the organ of Corti, including outer hair cells (box), inner hair cell (arrowhead) and supporting cells (arrow). b: The intensity of staining was increased by kanamycin treatment for 7 days; cathepsin D immunostaining was similar at 11 and 14 days of treatment. All images were taken from the basal turn in the organ of Corti. This figure is representative of five individual mice at each time point. Scale bar: 10 μm
Figure 9
Figure 9
Kanamycin leads to PARP1 degradation in the organ of Corti. 9-1: Western blot analysis of cochlear extracts showed that the 113 kDa of PARP1 was decreased after 7 days of kanamycin treatment, and more strongly decreased after treatment for 11 and 14 days. No 89 kDa fragment of PARP1 was present. Saline indicates saline control animals; Km 7, Km 11 and Km 14 indicates kanamycin treatment for 7, 11 and 14 days. GAPDH is a control of the loading amount of protein. This figure is representative of four individual experiments 9-2: Sections of organ of Corti were stained with anti-PARP1 antibody (red) and Hoechest-33342 (blue). a: In saline control animals immunostaining showed PARP1 localized in the nuclei of outer hair cells (a, box), inner hair cell (a, arrowhead) and supporting cells (a, arrow). b: After kanamycin treatment for 7 days PARP1 immunoreactivity was decreased in the nuclei of outer hair cells of the basal turn (b, box). c: PARP1 immunoreactivity further decreased after 11 days (c, box). This figure is representative of five individual mice at each time point. Scale bar: 10 μm

References

    1. Forge A, Schacht J. Aminoglycoside antibiotics. Audiol Neurootol. 2000;5:3–22. - PubMed
    1. Wu W-J, Sha S-H, McLaren JD, Kawamoto K, Raphael Y, Schacht J. Aminoglycoside ototoxicity in adult CBA, C57BL and BALB mice and the Sprague-Dawley rat. Hear Res. 2001;158:165–178. - PubMed
    1. Forge A, Li L. Apoptotic death of hair cells in mammalian vestibular sensory epithelia. Hear Res. 2000;139:97–115. - PubMed
    1. Pirvola U, Xing-Qun L, Virkkala J, Saarma M, Murakata C, Camoratto AM, Walton KM, Ylikoski J. Rescue of hearing, auditory hair cells, and neurons by CEP-1347/KT7515, an inhibitor of c-Jun N-terminal kinase activation. J Neurosci. 2000;20:43–50. - PMC - PubMed
    1. Cunningham LL, Cheng AG, Rubel EW. Caspase activation in hair cells of the mouse utricle exposed to neomycin. J Neurosci. 2002;22:8532–8540. - PMC - PubMed

Publication types

MeSH terms