Proliferation and invasion: plasticity in tumor cells
- PMID: 16024725
- PMCID: PMC1180792
- DOI: 10.1073/pnas.0504367102
Proliferation and invasion: plasticity in tumor cells
Abstract
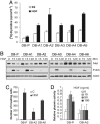
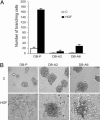
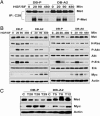
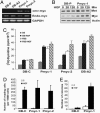
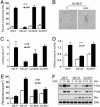
Invasive and proliferative phenotypes are fundamental components of malignant disease, yet basic questions persist about whether tumor cells can express both phenotypes simultaneously and, if so, what are their properties. Suitable in vitro models that allow characterization of cells that are purely invasive are limited because proliferation is required for cell maintenance. Here, we describe glioblastoma cells that are highly invasive in response to hepatocyte growth factor/scatter factor (HGF/SF). From this cell population, we selected subclones that were highly proliferative or displayed both invasive and proliferative phenotypes. The biological activities of invasion, migration, urokinase-type plasminogen activation, and branching morphogenesis exclusively partitioned with the highly invasive cells, whereas the highly proliferative subcloned cells uniquely displayed anchorage independent growth in soft agar and were highly tumorigenic as xenografts in immune-compromised mice. In response to HGF/SF, the highly invasive cells signal through the MAPK pathway, whereas the selection of the highly proliferative cells coselected for signaling through Myc. Moreover, in subcloned cells displaying both invasive and proliferative phenotypes, both signaling pathways are activated by HGF/SF. These results show how the mitogen-activated protein kinase and Myc pathways can cooperate to confer both invasive and proliferative phenotypes on tumor cells and provide a system for studying how transitions between invasion and proliferation can contribute to malignant progression.
Figures

Similar articles
-
Role of hepatocyte growth factor activator (HGF activator) in invasive growth of human glioblastoma cells in vivo.Int J Cancer. 2006 Feb 1;118(3):583-92. doi: 10.1002/ijc.21362. Int J Cancer. 2006. PMID: 16106403
-
The scatter factor/hepatocyte growth factor: c-met pathway in human embryonal central nervous system tumor malignancy.Cancer Res. 2005 Oct 15;65(20):9355-62. doi: 10.1158/0008-5472.CAN-05-1946. Cancer Res. 2005. PMID: 16230398
-
Scatter factor/hepatocyte growth factor protects against cytotoxic death in human glioblastoma via phosphatidylinositol 3-kinase- and AKT-dependent pathways.Cancer Res. 2000 Aug 1;60(15):4277-83. Cancer Res. 2000. PMID: 10945642
-
HGF/SF-met signaling in the control of branching morphogenesis and invasion.J Cell Biochem. 2003 Feb 1;88(2):408-17. doi: 10.1002/jcb.10358. J Cell Biochem. 2003. PMID: 12520544 Review.
-
Molecular characteristics of HGF-SF and its role in cell motility and invasion.EXS. 1993;65:311-28. EXS. 1993. PMID: 8380739 Review.
Cited by
-
Chromosome instability, chromosome transcriptome, and clonal evolution of tumor cell populations.Proc Natl Acad Sci U S A. 2007 May 22;104(21):8995-9000. doi: 10.1073/pnas.0700631104. Epub 2007 May 15. Proc Natl Acad Sci U S A. 2007. PMID: 17517657 Free PMC article.
-
The hypoxia-related microRNA miR-199a-3p displays tumor suppressor functions in ovarian carcinoma.Oncotarget. 2015 May 10;6(13):11342-56. doi: 10.18632/oncotarget.3604. Oncotarget. 2015. PMID: 25839163 Free PMC article.
-
Evolution of phenotypic plasticity leads to tumor heterogeneity with implications for therapy.PLoS Comput Biol. 2024 Aug 9;20(8):e1012003. doi: 10.1371/journal.pcbi.1012003. eCollection 2024 Aug. PLoS Comput Biol. 2024. PMID: 39121170 Free PMC article.
-
Life History Trade-Offs in Tumors.Curr Pathobiol Rep. 2018;6(4):201-207. doi: 10.1007/s40139-018-0188-4. Epub 2018 Nov 10. Curr Pathobiol Rep. 2018. PMID: 30595969 Free PMC article. Review.
-
Integrative network analysis of early-stage lung adenocarcinoma identifies aurora kinase inhibition as interceptor of invasion and progression.Nat Commun. 2022 Mar 24;13(1):1592. doi: 10.1038/s41467-022-29230-7. Nat Commun. 2022. PMID: 35332150 Free PMC article.
References
-
- Liotta, L. A. & Stetler-Stevenson, W. G. (1991) Cancer Res. 51, Suppl. 18, 5054s-5059s. - PubMed
-
- Hanahan, D. & Weinberg, R. A. (2000) Cell 100, 57-70. - PubMed
-
- Bernards, R. & Weinberg, R. A. (2002) Nature 418, 823. - PubMed
-
- Klein, C. A. (2004) Cell Cycle 3, 29-31. - PubMed
-
- Birchmeier, C., Birchmeier, W., Gherardi, E. & Vande Woude, G. F. (2003) Nat. Rev. Mol. Cell Biol. 4, 915-925. - PubMed
Publication types
MeSH terms
Substances
LinkOut - more resources
Full Text Sources
Other Literature Sources

