. 2005 Jul 15;33(12):3907-18.
doi: 10.1093/nar/gki699. Print 2005.

A-tract clusters may facilitate DNA packaging in bacterial nucleoid

Affiliations

A-tract clusters may facilitate DNA packaging in bacterial nucleoid

Michael Y Tolstorukov et al. Nucleic Acids Res. .

Abstract

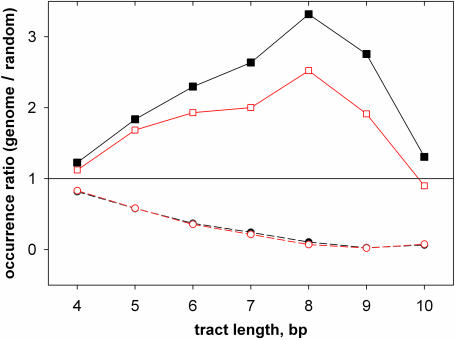
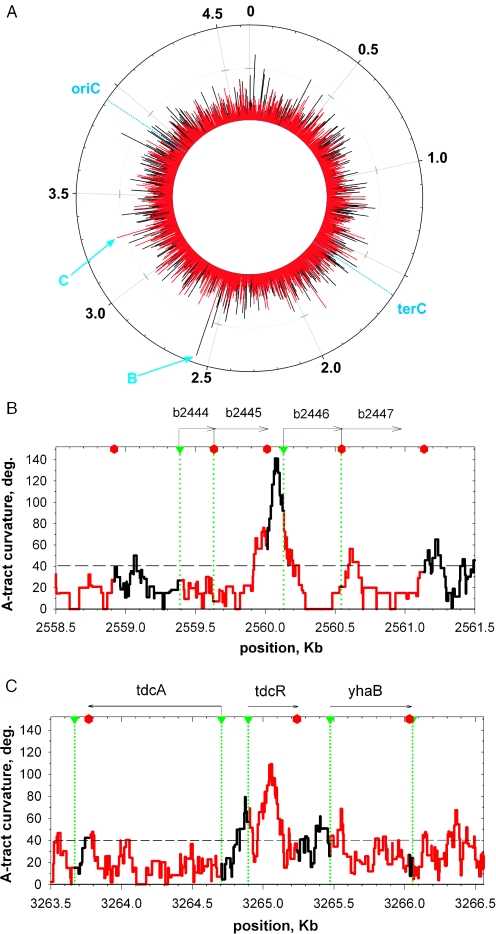
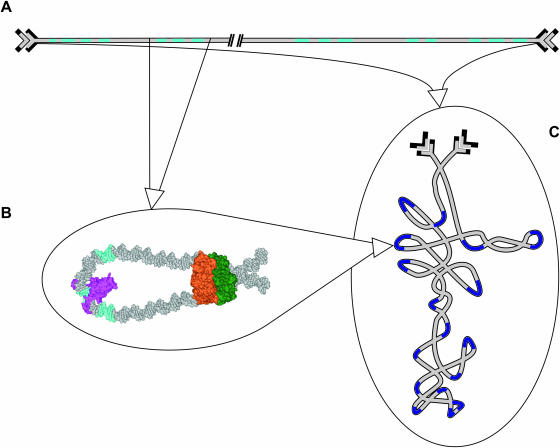
Molecular mechanisms of bacterial chromosome packaging are still unclear, as bacteria lack nucleosomes or other apparent basic elements of DNA compaction. Among the factors facilitating DNA condensation may be a propensity of the DNA molecule for folding due to its intrinsic curvature. As suggested previously, the sequence correlations in genome reflect such a propensity [Trifonov and Sussman (1980) Proc. Natl Acad. Sci. USA, 77, 3816-3820]. To further elaborate this concept, we analyzed positioning of A-tracts (the sequence motifs introducing the most pronounced DNA curvature) in the Escherichia coli genome. First, we observed that the A-tracts are over-represented and distributed 'quasi-regularly' throughout the genome, including both the coding and intergenic sequences. Second, there is a 10-12 bp periodicity in the A-tract positioning indicating that the A-tracts are phased with respect to the DNA helical repeat. Third, the phased A-tracts are organized in approximately 100 bp long clusters. The latter feature was revealed with the help of a novel approach based on the Fourier series expansion of the A-tract distance autocorrelation function. Since the A-tracts introduce local bends of the DNA duplex and these bends accumulate when properly phased, the observed clusters would facilitate DNA looping. Also, such clusters may serve as binding sites for the nucleoid-associated proteins that have affinities for curved DNA (such as HU, H-NS, Hfq and CbpA). Therefore, we suggest that the approximately 100 bp long clusters of the phased A-tracts constitute the 'structural code' for DNA compaction by providing the long-range intrinsic curvature and increasing stability of the DNA complexes with architectural proteins.


Figures

Figure 1
Figure 1
Schematic representation of the procedure used to calculate the ‘A-tract curvature’ for a DNA segment. (A) The A-tracts (shown in blue) interspersed with ‘random’ sequences (shown in gray) cause local DNA bending. Each bend is represented by a vector directed into the minor groove in the center of an A-tract, with the length proportional to the bending angle. (B) View along the DNA axis: the resulting ‘curvature vector’ (in red) is the vector sum of the A-tract bending vectors. The A-tract curvature was determined as the length of this vector.
Figure 2
Figure 2
A scheme illustrating definition of the DAF for A-tracts (underlined). The distances between the tract centers, xi, are in base pairs. If the length of an A-tract is odd (e.g. A5), its center coincides with the central base pair. If the A-tract length is even (e.g. AATT), its center is placed between the base pairs of its central dimeric step.
Figure 3
Figure 3
Relative occurrences of the A- and G-tracts in the E.coli genome. Given are the ratios of occurrences in genome to the average occurrences in 10 random sequences of the same base composition. Over-representation of the genomic A-tracts (AnTm) is statistically significant (P < 0.001, t-test) for the lengths (n + m) = 5–9 bp. Black lines with filled symbols represent the data for the entire genome and the red lines with open symbols represent the data for the coding sequences only (CDS). The A-tracts (solid lines with squares) are over-represented in the genome, while the G-tracts (dashed lines with circles) are under-represented (see Table 1 for the absolute numbers).
Figure 4
Figure 4
Distance autocorrelations of the (A) A-tracts and (B) G-tracts in the E.coli genome. The tract lengths vary from 4 to 7 bp; therefore, the distances between the tracts are considered to be 7 bp and larger. The data for the genomic DNA are represented by solid lines, and those for random sequences by dotted lines. Both genomic and random sequences have [G + C] = 51%. Note that in random sequences, the average occurrence of the A-tracts is somewhat less than that of the G-tracts [see the arrows in (A) and (B), respectively]; this is consistent with the GC-content exceeding 50%. The genomic DNA reveals an opposite trend: the absolute numbers for the A-tracts (A) are three times higher than those for the G-tracts (B). Also, periodicity of 10–12 bp is seen in the positioning of the peaks for the A-tracts [numbers in (A)], while no apparent regularity is seen for the G-tracts. The peaks in (A) marked with blue numbers are out of phase with the peaks marked with red numbers (see the main text).
Figure 5
Figure 5
Relative contributions of the periodicities into the net oscillating component of the A-tract autocorrelation function, DAF. (A) Intensity of the periodicity as a function of its period. Results were obtained by expanding the DAF (Figure 4A, solid line) into the Fourier series (see Methods for details). Calculations were performed for two data sets (sampling windows): solid line—the ‘first 100 bp’ (the DAF values for the distances 7–106 bp) and dotted line—the ‘second 100 bp’ (the DAF values for the distances 107–206 bp). Note that the peak at 11.1 bp is present only for the first window, while the peak at 3.0 bp is present for both windows. (B) Superposition of the zero frequency, 3.0 and 11.1 bp harmonics (solid line) is plotted against the DAF (dotted line). Note that the two non-zero harmonics are sufficient to reproduces the ‘spiky’ behavior of the autocorrelation function. (C) Superposition of the zero frequency and the 11.1 bp harmonics with the intensities calculated for the ‘first’ and the ‘second 100 bp’ windows (solid line) are plotted against the corresponding intervals of the DAF (dotted line).
Figure 6
Figure 6
Intensity of an oscillating component as a function of the sampling window position. The window positioning step was 10 bp. Three sizes of the sampling window were used: 80 bp (dotted black lines), 100 bp (solid red lines with circles) and 120 bp (dashed blue lines). (A) Intensity of the 10 au periodicity for the test function: f(x) = 5 − 2cos(2πx/10) for 1 ≤ x ≤ 100 and f(x) = 3 for x > 100 (‘au’ stands for arbitrary units; the test function is shown in the inset). Using all three window sizes results in a similar drop in the intensity when the window slides out of the periodicity range (from 1 to 100 au for the test function). When the window size is smaller than the periodicity length, a plateau precedes the drop, otherwise there is no such a plateau. The length of the periodicity can be evaluated as a half-height of the intensity drop (shown with an arrow). (B) Intensity of the 10–12 bp periodicity for the A-tract DAF. The periodicity lengths (shown with the arrows) amounted to ∼100 bp for all three sizes of the sampling window. Possible origin of the second maximum in the range of 170–210 bp is discussed in the text. (C) Intensity of the 3 bp periodicity for the A-tract DAF. Note that there is no drop in the intensity within the first 500 bp.
Figure 7
Figure 7
Distribution of the A-tract curvature in the E.coli genome. The A-tract curvature was calculated in the 100 bp sliding window with 1 bp step, according to Equation 1 and using the set of the twist angles from (47). (A) Circular diagram represents the A-tract curvature distribution in the entire E.coli genome (red, CDS; black, intergenic sequences). Origin and terminus of replication (63) are indicated. The numbers on the outmost circle indicate the position in the genome in millions of base pairs. The A-tract curvature values start at 40° (the points on the innermost circle). The cross bars at the radial lines correspond to 100° of curvature. (B and C) Two detailed pictures of the A-tract curvature distribution in the 3000 bp regions, indicated with arrows in (A). The start and termination sites of transcription are indicated with green triangles and red hexagons, respectively. The gene directions are shown with the hooked arrows. Notice that the strong peaks in A-tract curvature (up to 100°) are located both in the intergenic regions (B) and in the CDS (C).
Figure 8
Figure 8
Model of the A-tract assisted compaction of the bacterial chromosome. (A) Schematic representation of the A-tract distribution in a fragment of the bacterial genome. A-tracts are shown in cyan and non-A-tract DNA is shown in gray. Note that A-tracts are grouped in clusters. (B) Putative model of the bacterial ‘compactosome’ (64): a cluster of the phased A-tracts introduces DNA curvature, facilitating DNA looping by the architectural proteins. The color code used for the A-tracts and non-A-tract DNA is the same as in (A). Proteins assist in DNA bending (magenta) and secure the loop closure (ochre and green). This scheme is drawn by analogy with the gal-loop, where HU protein facilitates DNA bending, and Gal repressors secure the loop closure (65,66). (C) Under superhelical stress, the clusters of phased A-tracts (dark blue) would facilitate branching of the plectonemically supercoiled DNA, appearing at the apexes of the branches. Thus, the phased A-tract clusters may constitute a code for the sequence-directed packaging of the bacterial chromosome within the domains of supercoiling.

Similar articles

Cited by

References

    1. Pettijohn D.E., Sinden R.R. Structure of the isolated nucleoid. In: Nanninga N., editor. Molecular Cytology of Escherichia coli. London: Academic Press; 1985. pp. 199–227.
    1. Drlica K., Rouviere-Yaniv J. Histonelike proteins of bacteria. Microbiol. Rev. 1987;51:301–319. - PMC - PubMed
    1. Robinow C., Kellenberger E. The bacterial nucleoid revisited. Microbiol. Rev. 1994;58:211–232. - PMC - PubMed
    1. Case R.B., Chang Y.P., Smith S.B., Gore J., Cozzarelli N.R., Bustamante C. The bacterial condensin MukBEF compacts DNA into a repetitive, stable structure. Science. 2004;305:222–227. - PubMed
    1. Kleppe K., Ovrebo S., Lossius I. The bacterial nucleoid. J. Gen. Microbiol. 1979;112:1–13. - PubMed

Publication types