. 2005 Aug;25(15):6464-74.
doi: 10.1128/MCB.25.15.6464-6474.2005.

Transformation of human and murine fibroblasts without viral oncoproteins

Affiliations

Transformation of human and murine fibroblasts without viral oncoproteins

Jesse S Boehm et al. Mol Cell Biol. 2005 Aug.

Abstract

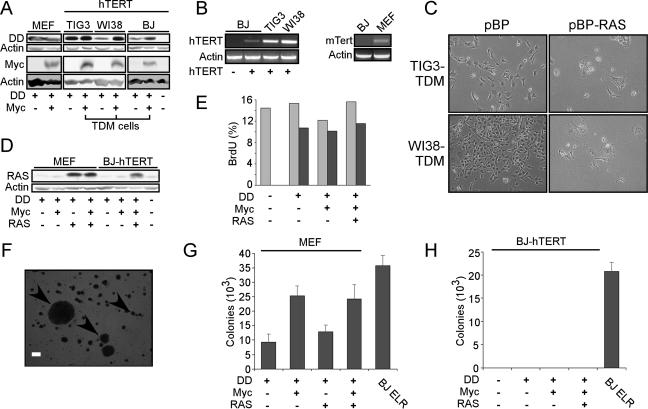
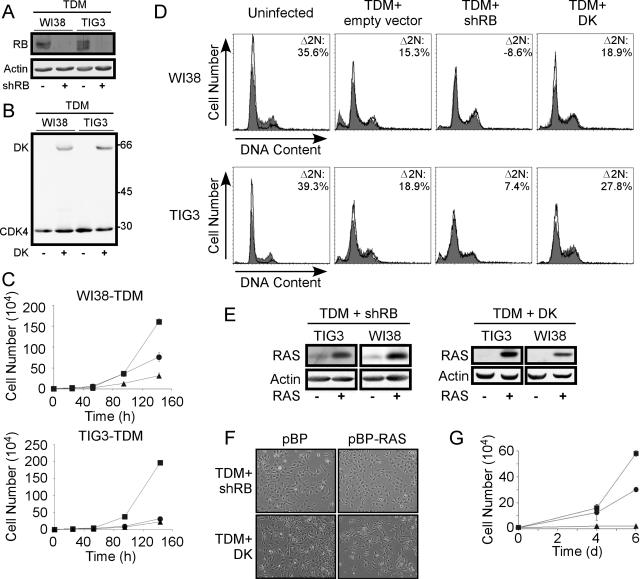
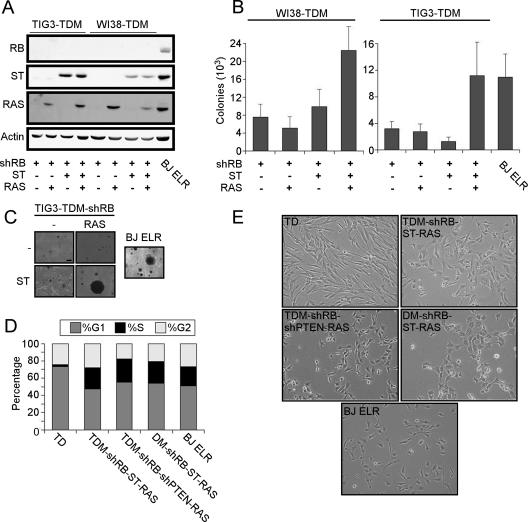
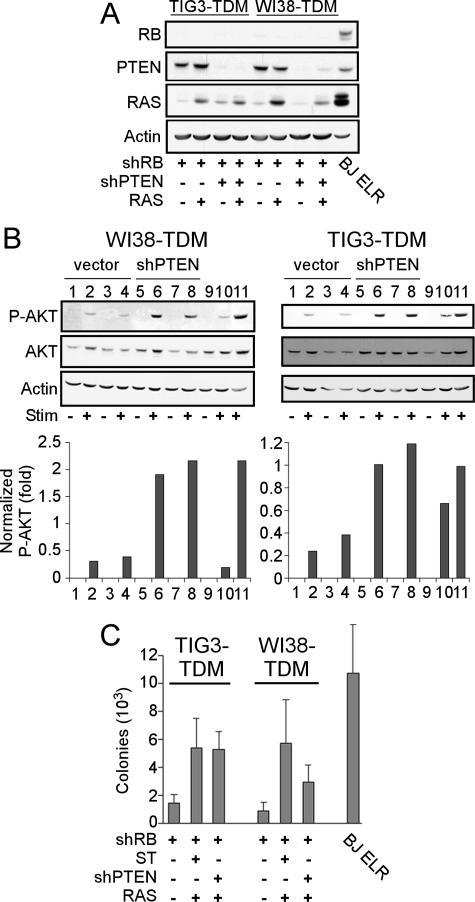
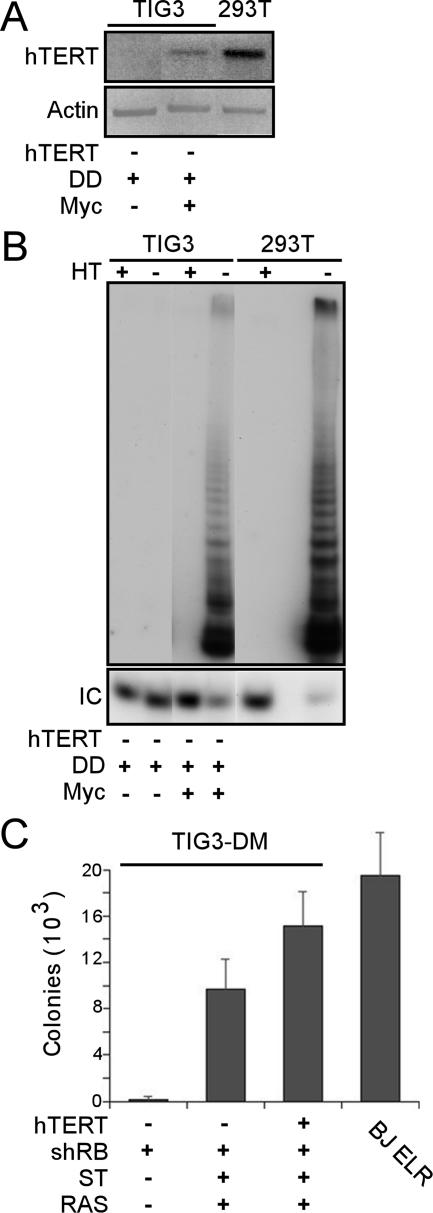
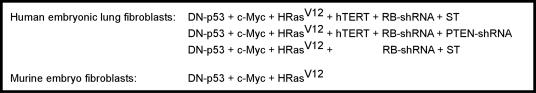
Murine embryo fibroblasts are readily transformed by the introduction of specific combinations of oncogenes; however, the expression of those same oncogenes in human cells fails to convert such cells to tumorigenicity. Using normal human and murine embryonic fibroblasts, we show that the transformation of human cells requires several additional alterations beyond those required to transform comparable murine cells. The introduction of the c-Myc and H-RAS oncogenes in the setting of loss of p53 function efficiently transforms murine embryo fibroblasts but fails to transform human cells constitutively expressing hTERT, the catalytic subunit of telomerase. In contrast, transformation of multiple strains of human fibroblasts requires the constitutive expression of c-Myc, H-RAS, and hTERT, together with loss of function of the p53, RB, and PTEN tumor suppressor genes. These manipulations permit the development of transformed human fibroblasts with genetic alterations similar to those found associated with human cancers and define specific differences in the susceptibility of human and murine fibroblasts to experimental transformation.


Figures

FIG. 1.
FIG. 1.
Expression of hTERT fails to cooperate with the expression of DN-p53 (DD), Myc, and RAS to transform human fibroblasts. (A) Immunoblotting to confirm expression of DD and Myc in murine and human cells. Cell lines include MEFs and TIG3, WI38, and BJ strains of human fibroblasts expressing hTERT. Human cells expressing hTERT, DD, and Myc are designated TDM cells. A total of 50 μg of total cell protein (DD) or total cell lysate corresponding to approximately 2 × 10⁵ cells (Myc) was separated on a 7.5 to 15% gradient gel (DD) or a 10% gel (Myc) and immunoblotted for indicated proteins. (B) Expression of hTERT and mTert in asynchronously dividing human and murine cells, respectively. RT-PCR for introduced hTERT or endogenous mTert was performed on total RNA (500 ng). Since asynchronously dividing cells were used, these experimental conditions do not permit the detection of S-phase-specific hTERT expression in human cells. (C) Induction of RAS-induced senescence in TIG3-TDM and WI38-TDM cells. Micrographs depict nonsenescent or senescent morphology of TDM cells infected with pBabe-Puro (pBP) or pBabe-Puro-RAS (pBP-RAS), respectively, shown at ×100 magnification. (D) Immunoblotting to confirm expression of RAS in matched MEF-DM and BJ-TDM cell lines. Immunoblotting was performed as in panel A for DD expression. (E) Assessment of p53 function. BJ-hTERT cells expressing the indicated constructs were subjected to ionizing radiation (5 Gy), labeled with BrdU, and subjected to fluorescence-activated cell sorting. Light gray bars indicate nonirradiated cultures, and dark gray bars indicate irradiated cultures. This experiment was performed in duplicate, and representative results are shown. (F) Micrograph demonstrating the types of colonies scored in these experiments. Bar, 200 μm. (G) Anchorage-independent growth of MEFs expressing the indicated genes. The data are expressed as the mean ± the standard deviation (SD) of triplicate determinations. (H) Anchorage-independent growth of BJ-hTERT cells expressing the indicated genes. No significant colony growth of any BJ-hTERT cell lines was observed after 6 weeks, compared to transformed BJ ELR cells that express hTERT, SV40 LT, ST, and RAS (19).
FIG. 2.
FIG. 2.
Perturbation of the RB pathway. (A) shRNA-mediated suppression of RB in WI38-TDM and TIG3-TDM cells, as determined by immunoblotting. (B) Expression of the cyclin D1-CDK4R24C fusion protein (41) (DK) in WI38-TDM and TIG3-TDM cells. The CDK4-specific antibody detects both endogenous CDK4 and exogenous DK in immunoblotting. Molecular masses in kilodaltons are shown on the right. (C) Proliferation of WI38-TDM and TIG3-TDM cells expressing a control vector (▴), shRB (•), or DK (▪). For each cell line, 104 cells were plated and counted at the indicated time points. Each point is represented as the mean ± the SD of triplicate determinations. Error bars are shown for each point; however, in some cases the symbol covers the error bars. (D) Disruption of the G1/S checkpoint by shRB. Cells expressing the indicated genes were serum starved (1% serum) for 48 h (WI38 cells) or 24 h (TIG3 cells). Cells were stained with PI and subjected to flow cytometric analysis. Shaded profiles indicate parallel cultures maintained in 10% serum; open profiles represent tracings derived from starved cells. We examined the percentage of cells with 2 N DNA content under each condition to assess the capacity of the each cell population to arrest in G0/G1 in response to starvation. The percentage of cells with 2 N DNA content (%2N) was determined by using BD CellQuest Pro software and Δ2N represents the percentage change between starved and 10% serum conditions, i.e., (%2N starved − %2N serum)/%2N serum × 100. Larger Δ2N values reflect cultures retaining the capacity to arrest in response to serum, while smaller Δ2N values reflect cell populations that have lost the capacity to respond appropriately to starvation. (E) shRB and DK permit cells to express RAS. RAS was introduced into TIG3-TDM and WI38-TDM cells expressing shRB or DK. Cells that expressed shRB or DK did not undergo RAS-induced senescence as in Fig. 1C but instead proliferated with robust levels of RAS expression. (F) Suppression of RAS-induced senescence morphology in WI38-TDM cells expressing shRB or DK. Micrographs depict cells infected with pBabe-Puro (pBP) or pBabe-Puro-RAS (pBP-RAS), respectively, shown at ×100 magnification. Similar results were observed with TIG3-TDM cells (not shown). (G) Suppression of RAS-induced proliferative arrest by shRB or DK. A total of 104 cells were plated in triplicate at day 0 and infected with RAS-expressing virus at both day 1 and day 2. Cells were counted as in panel C at the indicated time points. Symbols are as defined in panel C. Proliferation of WI38 cells is shown; similar results were observed with TIG3 cells (not shown).
FIG. 3.
FIG. 3.
ST cooperates with RAS to transform cells expressing TDM and shRB. (A) Immunoblotting for introduced genes. Suppression of RB and expression of ST and RAS was confirmed in TIG3-TDM and WI38-TDM cell lines engineered to express the indicated proteins by immunoblotting for indicated proteins (50 μg). BJ ELR cells were used as a positive control. (B) Anchorage-independent growth of cell lines expressing the indicated genes, compared to BJ ELR cells. (C) Representative micrographs are shown to demonstrate colony sizes of TIG3-TDM or BJ ELR fibroblasts expressing the indicated constructs. (D) Contact inhibition at confluence. The indicated cells were grown to confluence and maintained for 48 h before labeling with PI. Cell cycle profiles were analyzed by using ModFit Software, and the fraction of cells in each phase is shown as a shaded region of each bar as indicated. (E) Cell morphology. Transformed cells display an altered morphology characterized by irregular-sized cells with a vacuolated appearance, similar to that observed with BJ ELR cells. Representative micrographs are shown depicting TIG3 cells expressing the indicated constructs, shown at ×100 magnification. Similar results were obtained with WI38 cells.
FIG. 4.
FIG. 4.
shPTEN replaces ST in transformation of cells expressing TDM, shRB, and RAS. (A) Suppression of RB and PTEN and expression of RAS were confirmed by immunoblotting. (B) Effects of shPTEN on AKT phosphorylation. WI38-TDM or TIG3-TDM cell lines expressing shRB (lanes 1 and 2), shRB and RAS (lanes 3 and 4); shRB and shPTEN (lanes 5 and 6); shRB, shPTEN, and RAS (lanes 7 and 8); or shRB, ST, and RAS (lanes 9 and 10) were starved overnight in 0.1% serum (Stim −) and then stimulated with 10% serum for 1 h (Stim +). Immunoblotting for P-AKT and AKT was performed on total cell lysates (50 μg). P-AKT levels were normalized to total AKT levels by densitometry. Lane 11 represents a control cell line expressing high levels of activated PI3K under stimulated conditions. (C) Anchorage-independent growth. The results are shown as the mean ± the SD for triplicate determinations.
FIG. 5.
FIG. 5.
Myc activates hTERT in human cell transformation. (A) Detection of hTERT in Myc-expressing cells. TIG3 cells were infected serially with DD, Myc, shRB, ST, and RAS viruses. RT-PCR was performed on 500 ng of RNA harvested from TIG3-DM-shRB-ST-RAS cells (Myc +) or TIG3-D cells (Myc −) by using primers specific for endogenous hTERT. Cells did not undergo replicative senescence. (B) Detection of telomerase activity in TIG3-DM-shRB-ST-RAS (Myc +) cells. The PCR-based TRAP assay was performed as previously described (25, 30). HT, heat-treated samples; IC, TRAP internal control. Telomerase activity was detectable in all cell lines after the introduction of Myc (data not shown) but not in TIG3-D cells (Myc −). (C) Anchorage-independent growth of DM-shRB-ST-RAS cells compared to TDM-shRB-ST-RAS cells. The results are shown as the mean ± the SD for triplicate determinations.
FIG. 6.
FIG. 6.
Summary of findings. DN-p53, Myc, and RAS suffice to transform MEFs. In contrast, the additional expression of hTERT, RB-shRNA, and either ST or PTEN-shRNA are sufficient to transform human embryonic lung fibroblasts. Alternatively, Myc activates hTERT to levels sufficient to permit transformation.

References

    1. Allsopp, R. C., H. Vaziri, C. Patterson, S. Goldstein, E. V. Younglai, A. B. Futcher, C. W. Greider, and C. B. Harley. 1992. Telomere length predicts replicative capacity of human fibroblasts. Proc. Natl. Acad. Sci. USA 89:10114-10118. - PMC - PubMed
    1. Andjelkovic, M., T. Jakubowicz, P. Cron, X. F. Ming, J. W. Han, and B. A. Hemmings. 1996. Activation and phosphorylation of a pleckstrin homology domain containing protein kinase (RAC-PK/PKB) promoted by serum and protein phosphatase inhibitors. Proc. Natl. Acad. Sci. USA 93:5699-5704. - PMC - PubMed
    1. Baker, B. W., D. Boettiger, E. Spooncer, and J. D. Norton. 1992. Efficient retroviral-mediated gene transfer into human B lymphoblastoid cells expressing mouse ecotropic viral receptor. Nucleic Acids Res. 20:5234. - PMC - PubMed
    1. Beausejour, C. M., A. Krtolica, F. Galimi, M. Narita, S. W. Lowe, P. Yaswen, and J. Campisi. 2003. Reversal of human cellular senescence: roles of the p53 and p16 pathways. EMBO J. 22:4212-4222. - PMC - PubMed
    1. Benanti, J. A., and D. A. Galloway. 2004. Normal human fibroblasts are resistant to RAS-induced senescence. Mol. Cell. Biol. 24:2842-2852. - PMC - PubMed

MeSH terms