Comparative Study
. 2005 Aug;25(15):6789-97.
doi: 10.1128/MCB.25.15.6789-6797.2005.

DNA replication origin plasticity and perturbed fork progression in human inverted repeats

Affiliations
Comparative Study

DNA replication origin plasticity and perturbed fork progression in human inverted repeats

Ronald Lebofsky et al. Mol Cell Biol. 2005 Aug.

Abstract

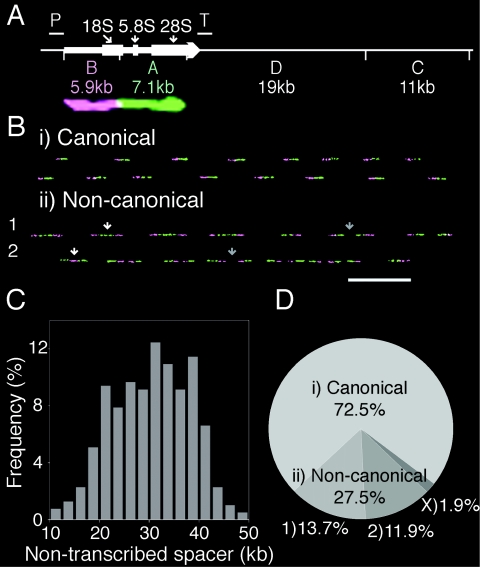
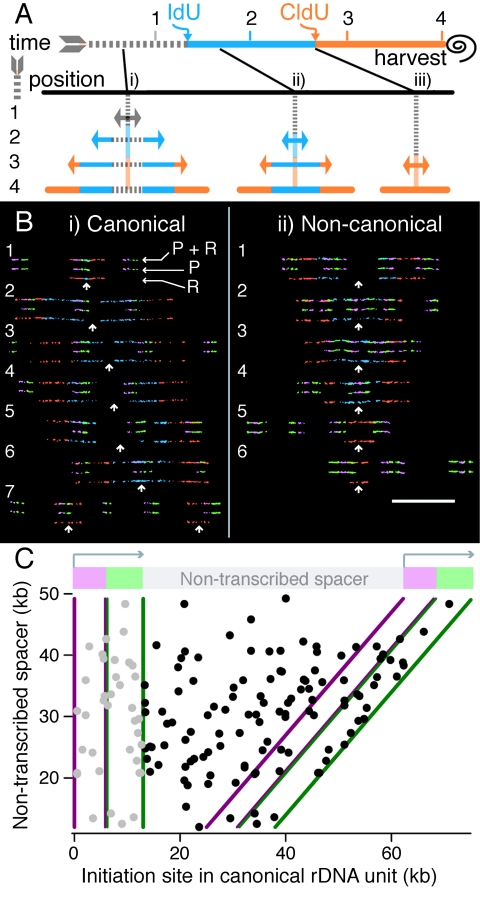
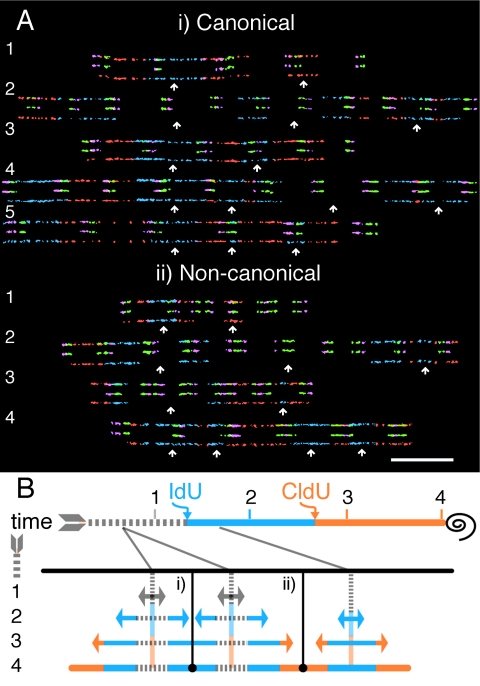
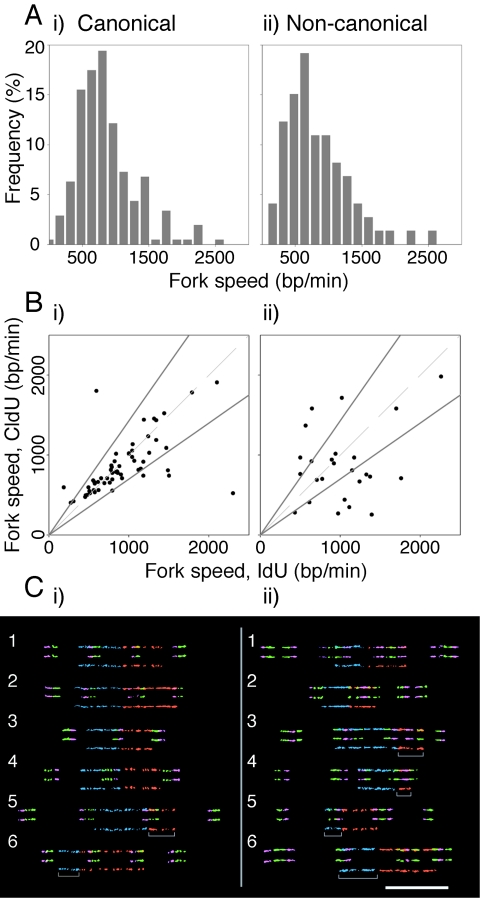
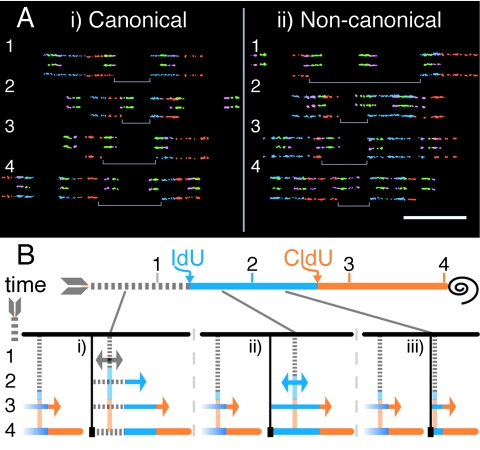
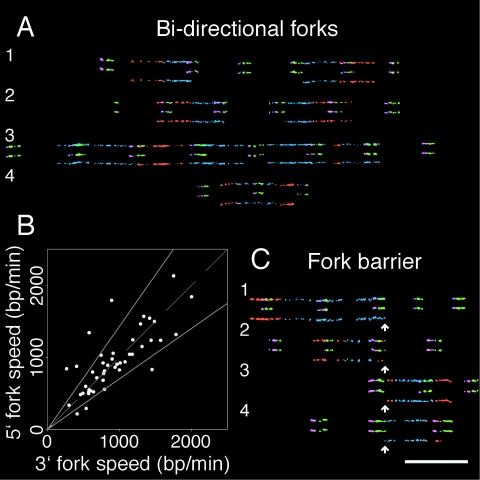
The stability of metazoan genomes during their duplication depends on the spatiotemporal activation of origins and the progression of forks. Human rRNA genes represent a unique challenge to DNA replication since a large proportion of them exist as noncanonical palindromes in addition to canonical tandem repeats. Whether origin usage and/or fork elongation can cope with the variable structure of these genes is unknown. By analyzing single combed DNA molecules from HeLa cells, we studied the rRNA gene replication program according to the organization of canonical versus noncanonical rRNA genes. Origin positioning, spacing, and timing were not affected by the underlying rRNA gene physical structure. Conversely, fork arrest, both temporary and permanent, occurred more frequently when rRNA gene palindromes were encountered. These findings reveal that while initiation mechanisms are flexible enough to adapt to an rRNA gene structure of any arrangement, palindromes represent obstacles to fork progression, which is a likely source of genomic instability.


Figures

FIG. 1.
FIG. 1.
Genomic structure of human rRNA genes. (A) Classical structure of one rRNA gene unit. The horizontal arrow represents the transcribed region, with the 18S, 5.8S, and 28S rRNA coding regions shown as thicker boxes. EcoRI restriction sites, indicated by short vertical white lines, divide the 43-kb rRNA gene unit into four fragments, i.e., A, B, C, and D. Promoter and transcription termination sequences are denoted by “P” and “T,” respectively. An example of an enlarged hybridized probe signal corresponding to a single classical rRNA gene unit is provided. (Adapted from reference with permission of the publisher.) (B) Physical structure of human rRNA genes based on probes hybridized to combed molecules. Canonical units for two molecules are shown in panel i, and noncanonical units for two molecules are shown in panel ii. White arrows indicate type 1 and type 2 noncanonical palindromic units. The darker arrows for both types of noncanonical units point out transcribed sequence palindromes separated by nontranscribed spacer DNA. Bar = 50 kb. (C) Histogram showing the nontranscribed spacer length distribution in HeLa canonical rRNA genes. (D) Pie chart showing the relative percentages of canonical and noncanonical rRNA genes in HeLa cells, with a breakdown of type 1 and 2 noncanonical units. Type X rRNA genes contain multiple contiguous 5′-3′ transcribed regions, but they are not shown here because their contribution to human rRNA genes is significantly reduced.
FIG. 2.
FIG. 2.
DNA replication initiation mapping at human rRNA genes. (A) Expected replication signals from bidirectional origins on combed DNA. Asynchronous cells were initially labeled with IdU (blue) followed by CldU (red) and then harvested. The black spiral denotes the end of the labeling period and the time of cell harvest. A schematic of a combed DNA molecule with the positions of three potential initiation events (i, ii, and iii) is provided. The black lines joining the time scale with the sites of initiation show when during labeling the origins fire. Initiation event i occurs prior to the incorporation of modified nucleotides. Initiation event ii occurs during the IdU pulse, and event iii occurs during the CldU pulse. The processes of replication and nucleotide incorporation are provided for the three previous time points, 1, 2, and 3, that give rise to the three types of signals used for initiation mapping. (B) Observed initiation events in the human rRNA gene locus. Fibers with probes specific for the rRNA gene transcription unit (3′ infrared, 5′ green) containing replication signals for initiation mapping are shown for canonical (i) and noncanonical (ii) rRNA genes. To facilitate understanding, four-color molecules containing both probe and replication (P + R) signals were vertically decomposed into the corresponding two-color probe (P) and replication (R) images. White arrows indicate the sites of initiation. Molecules 1 and 6 (i) and 2 to 4 (ii) contain origins that map to the rRNA coding genes. Fiber 7 in panel i contains two origins that occured during the CldU pulse, thefirst one in the transcription unit and the second in the nontranscribed spacer. The initiation sites in molecules 2 to 5 (i) and molecules 1, 5, and 6 (ii) are positioned in the intergenic spacers. Bar = 50 kb. (C) Scatter plot of origin positions in canonical rRNA genes. For canonical units, the nontranscribed spacers separating the rRNA genes vary in size. Initiation sites are shown (black circles) as a function of the nontranscribed spacer length in the rRNA gene units where the origins were found. Initiation events in the transcription unit were replotted for the preceding transcription unit (light gray circles) to help visualize whether an initiation zone at the 3′ end of the gene exists.
FIG. 3.
FIG. 3.
Origin spacing and timing in canonical and noncanonical rRNA genes. (A) Single molecules containing multiple initiation events and fork merges. White arrows denote origin positions. Molecules were aligned according to the position of the first origin. Only two origin neighbors can be observed in molecules 1 and 3 for both panels i and ii. Three initiation events are found in the remaining fibers, except for molecule 4 in panel ii, which contains four origins. A merge between oncoming forks cannot be observed for the pair of origins in fiber 1 for both panels i and ii. A merge during the IdU pulse can be observed for the second fiber in panels i and ii. The remainder of the molecules contain signals with fork merges occurring during CldU labeling. Bar = 50 kb. (B) Expected signals of merged forks from multiple initiation sites on a single fiber. As shown in Fig. 1, the sequential labeling of IdU (blue) followed by CldU (red) and subsequent cell harvesting (black spiral) are shown. Vertical black lines represent the positions of merging forks. In panel i, a merge occurs during the IdU pulse, and in panel ii, a merge occurs during the CldU pulse, with the outcomes given at time point 4. The prior nucleotide incorporation giving rise to these two types of merge signals from three origins is provided for time points 1, 2, and 3. The timing of origin activation is shown in relation to the addition of the IdU/CldU pulse labels by gray solid lines.
FIG. 4.
FIG. 4.
Effect of noncanonical rRNA genes on fork progression. (A) Histograms showing fork speed distributions for canonical (i) and noncanonical (ii) rRNA genes. (B) Fork speeds based on IdU and CldU tracts from single forks plotted against each other for canonical (i) and noncanonical (ii) rRNA genes. The dashed gray lines represent equal speeds calculated from IdU and CldU labels of the same length. The two solid lines represent thresholds that allow for a 30% difference in fork speed between the IdU and CldU pulses. (C) Forks with speed information available from both IdU and CldU labels. Molecules 1 to 4 for canonical rRNA genes (i) and molecules 1 and 2 for noncanonical rRNA genes (ii) contain IdU and CldU tracts of approximately the same length. Molecules 5 and 6 (i) and 3 to 6 (ii) are examples of data excluded by the thresholds established in panel B. They have IdU and CldU replication tracts from single forks that differ by >30%. The gray open rectangles indicate the regions of fork stalling.
FIG. 5.
FIG. 5.
Unidirectional forks as a result of permanent fork arrest. (A) Examples of forks that are not coupled to a second fork moving away from single origins in canonical (i) and noncanonical (ii) rRNA genes. In the left part of each molecule, incoming replication signals are observed from a nearby origin in the region where an outgoing bidirectional fork counterpart is expected but absent. In panel i, molecules 3 and 4 possess complete replication signals from a neighboring origin in place of a simple incoming replication signal. Gray open rectangles denote all possible sites of fork blocking, as explained for panel B. (B) Scheme to explain three possibilities of events that give rise to a unidirectional fork. The IdU and CldU labeling periods are denoted by horizontal blue and red lines, respectively, followed by a black spiral signifying cell harvest. The horizontal black lines are divided to indicate that the three unidirectional forks occur on different molecules. Gray lines give the time of origin firing relative to the labeling periods for three origins that yield unidirectional forks. In panel i, an origin fires prior to labeling. One of the forks is blocked at some distance from the initiation site. A similar situation occurs in panel ii; however, initiation occurs during the IdU pulse. In panel iii, one fork is blocked at the origin. The replication signal outcomes are shown at time point 4 for all three cases. The processes of fork progression preceding the observed signals are given for time points 1, 2, and 3. Vertical black lines represent the positions of fork arrest.
FIG. 6.
FIG. 6.
Quantifying the fork barrier efficiency in canonical rRNA genes. (A) Fibers with similar bidirectional fork speeds for single origins. For molecules 1 to 3, the speeds from the IdU label are available since initiation occurred prior to IdU labeling. Speeds from the bidirectional forks could be calculated based on the CldU labels for molecules 1, 2, and 4 since merging with forks from other origins did not occur during this labeling period. (B) Bidirectional fork speeds from single origins plotted against each other. The fork direction was determined by the 5′-3′ orientation of the transcription unit. Forks with equal speeds are denoted by the dashed line. Thresholds corresponding to a 30% difference in speeds for diverging forks are shown with solid lines. (C) Position of the fork barrier based on the site where one of the two bidirectional forks from a single origin stopped. All molecules resulted in bidirectional fork speed data excluded by the thresholds in panel B. White arrows indicate the positions of fork barriers.

Similar articles

Cited by

References

    1. Akgun, E., J. Zahn, S. Baumes, G. Brown, F. Liang, P. J. Romanienko, S. Lewis, and M. Jasin. 1997. Palindrome resolution and recombination in the mammalian germ line. Mol. Cell. Biol. 17:5559-5570. - PMC - PubMed
    1. Anglana, M., F. Apiou, A. Bensimon, and M. Debatisse. 2003. Dynamics of DNA replication in mammalian somatic cells: nucleotide pool modulates origin choice and interorigin spacing. Cell 114:385-394. - PubMed
    1. Bensimon, A., A. Simon, A. Chiffaudel, V. Croquette, F. Heslot, and D. Bensimon. 1994. Alignment and sensitive detection of DNA by a moving interface. Science 265:2096-2098. - PubMed
    1. Brewer, B. J., and W. L. Fangman. 1988. A replication fork barrier at the 3′ end of yeast ribosomal RNA genes. Cell 55:637-643. - PubMed
    1. Brewer, B. J., D. Lockshon, and W. L. Fangman. 1992. The arrest of replication forks in the rDNA of yeast occurs independently of transcription. Cell 71:267-276. - PubMed

Publication types

LinkOut - more resources