

Evaluation of regulatory potential and conservation scores for detecting cis-regulatory modules in aligned mammalian genome sequences
- PMID: 16024817
- PMCID: PMC1182217
- DOI: 10.1101/gr.3642605
Evaluation of regulatory potential and conservation scores for detecting cis-regulatory modules in aligned mammalian genome sequences
Abstract
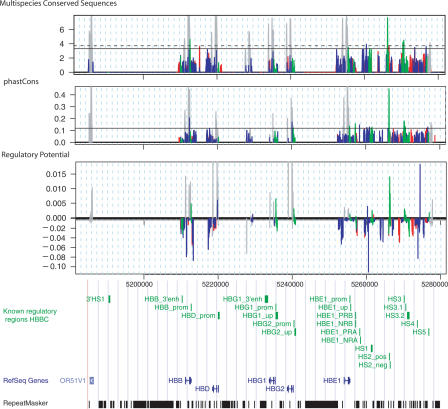
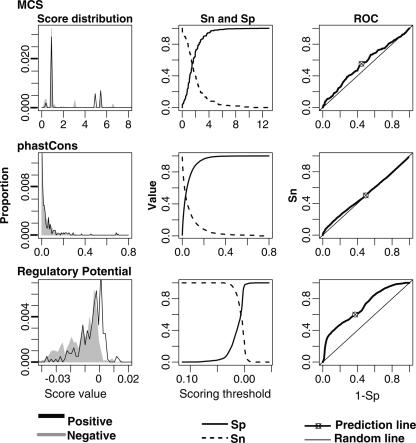
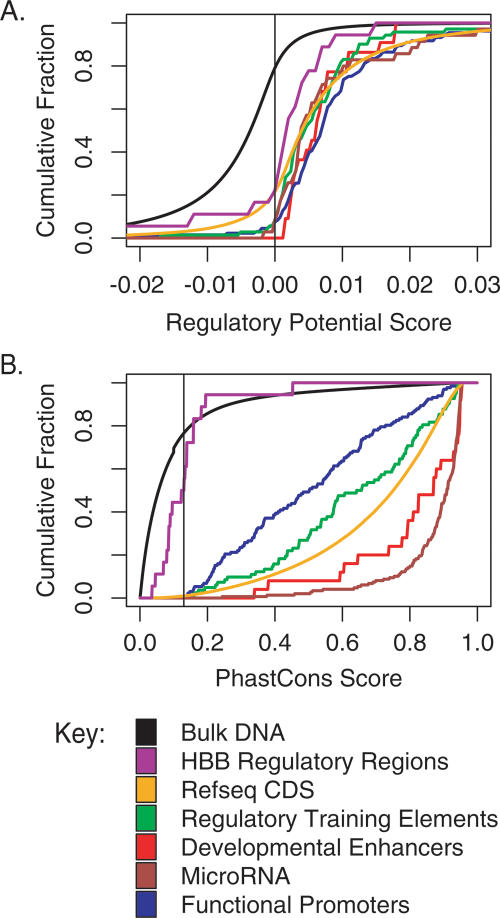
Techniques of comparative genomics are being used to identify candidate functional DNA sequences, and objective evaluations are needed to assess their effectiveness. Different analytical methods score distinctive features of whole-genome alignments among human, mouse, and rat to predict functional regions. We evaluated three of these methods for their ability to identify the positions of known regulatory regions in the well-studied HBB gene complex. Two methods, multispecies conserved sequences and phastCons, quantify levels of conservation to estimate a likelihood that aligned DNA sequences are under purifying selection. A third function, regulatory potential (RP), measures the similarity of patterns in the alignments to those in known regulatory regions. The methods can correctly identify 50%-60% of noncoding positions in the HBB gene complex as regulatory or nonregulatory, with RP performing better than do other methods. When evaluated by the ability to discriminate genomic intervals, RP reaches a sensitivity of 0.78 and a true discovery rate of approximately 0.6. The performance is better on other reference sets; both phastCons and RP scores can capture almost all regulatory elements in those sets along with approximately 7% of the human genome.
Figures
Similar articles
-
Experimental validation of predicted mammalian erythroid cis-regulatory modules.Genome Res. 2006 Dec;16(12):1480-92. doi: 10.1101/gr.5353806. Epub 2006 Oct 12. Genome Res. 2006. PMID: 17038566 Free PMC article.
-
ESPERR: learning strong and weak signals in genomic sequence alignments to identify functional elements.Genome Res. 2006 Dec;16(12):1596-604. doi: 10.1101/gr.4537706. Epub 2006 Oct 19. Genome Res. 2006. PMID: 17053093 Free PMC article.
-
Comparison of five methods for finding conserved sequences in multiple alignments of gene regulatory regions.Nucleic Acids Res. 1999 Oct 1;27(19):3899-910. doi: 10.1093/nar/27.19.3899. Nucleic Acids Res. 1999. PMID: 10481030 Free PMC article.
-
Use of long sequence alignments to study the evolution and regulation of mammalian globin gene clusters.Mol Biol Evol. 1993 Jan;10(1):73-102. doi: 10.1093/oxfordjournals.molbev.a039991. Mol Biol Evol. 1993. PMID: 8383794 Review.
-
Bioinformatics for the 'bench biologist': how to find regulatory regions in genomic DNA.Nat Immunol. 2004 Aug;5(8):768-74. doi: 10.1038/ni0804-768. Nat Immunol. 2004. PMID: 15282556 Review.
Cited by
-
Metrics of sequence constraint overlook regulatory sequences in an exhaustive analysis at phox2b.Genome Res. 2008 Feb;18(2):252-60. doi: 10.1101/gr.6929408. Epub 2007 Dec 10. Genome Res. 2008. PMID: 18071029 Free PMC article.
-
MicroRNA-298 reduces levels of human amyloid-β precursor protein (APP), β-site APP-converting enzyme 1 (BACE1) and specific tau protein moieties.Mol Psychiatry. 2021 Oct;26(10):5636-5657. doi: 10.1038/s41380-019-0610-2. Epub 2020 Jan 15. Mol Psychiatry. 2021. PMID: 31942037 Free PMC article.
-
Distinct DNA methylation patterns characterize differentiated human embryonic stem cells and developing human fetal liver.Genome Res. 2009 Jun;19(6):1044-56. doi: 10.1101/gr.088773.108. Epub 2009 Mar 9. Genome Res. 2009. PMID: 19273619 Free PMC article.
-
Genetic variants of MARCO are associated with susceptibility to pulmonary tuberculosis in a Gambian population.BMC Med Genet. 2013 Apr 23;14:47. doi: 10.1186/1471-2350-14-47. BMC Med Genet. 2013. PMID: 23617307 Free PMC article.
-
Mapping of transcription start sites of human retina expressed genes.BMC Genomics. 2007 Feb 7;8:42. doi: 10.1186/1471-2164-8-42. BMC Genomics. 2007. PMID: 17286855 Free PMC article.
References
-
- Allan, M., Lanyon, G., and Paul, J. 1983. Multiple origins of transcription in the 4.5 kb upstream of the ε-globin gene. Cell 35: 187–197. - PubMed
-
- Bender, M., Reik, A., Close, J., Telling, A., Epner, E., Fiering, S., Hardison, R., and Groudine, M. 1998. Description and targeted deletion of 5′ HS5 and 6 of the mouse β-globin locus control region. Blood 92: 4394–4403. - PubMed
-
- Berman, B.P., Pfeiffer, B.D., Laverty, T.R., Salzberg, S.L., Rubin, G.M., Eisen, M.B., and Celniker, S.E. 2004. Computational identification of developmental enhancers: Conservation and function of transcription factor binding-site clusters in Drosophila melanogaster and Drosophila pseudoobscura. Genome Biol. 5: R61. - PMC - PubMed
Web site references
-
- http://www.bx.psu.edu/; GALA and dbERGEII databases
-
- http://www.bx.psu.edu/~ross/dataset/DatasetHome.html; reference set of CRMs in HBB gene complex
-
- http://genome.ucsc.edu/; Genome Browser at UCSC
-
- http://research.nhgri.nih.gov/MCS/; WebMCS for computing multispecies conserved sequences
-
- http://www.sanger.ac.uk/Software/Rfam/mirna/index.shtml miRNA Registry
Publication types
MeSH terms
Substances
Grants and funding
LinkOut - more resources
Full Text Sources
Other Literature Sources