. 2005 Aug;15(8):1086-94.
doi: 10.1101/gr.3895005. Epub 2005 Jul 15.

The scale of mutational variation in the murid genome

Affiliations

The scale of mutational variation in the murid genome

Daniel J Gaffney et al. Genome Res. 2005 Aug.

Abstract

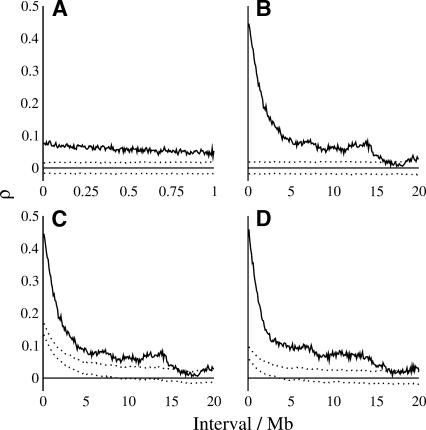
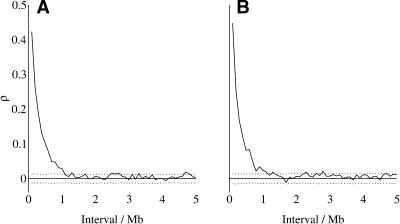
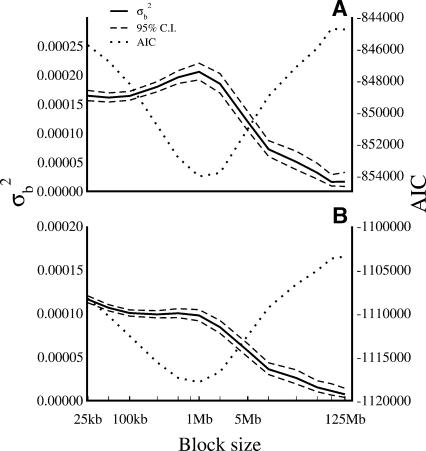
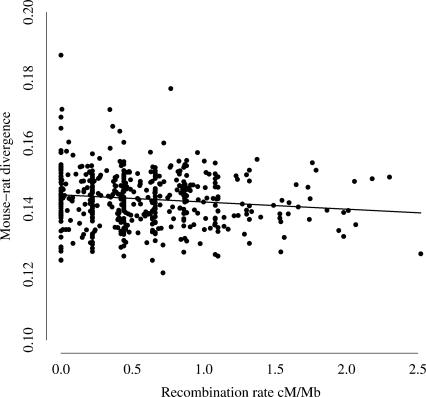
Mutation rates vary across mammalian genomes, but little is known about the scale over which this variation occurs. Knowledge of the magnitude and scale of mutational variation is required to understand the processes that drive mutation, and is essential in formulating a robust null hypothesis for comparative genomics studies. Here we estimate the scale of mutational variation in the murid genome by calculating the spatial autocorrelation of nucleotide substitution rates in ancestral repeats. Such transposable elements are good candidates for neutrally evolving sequence and therefore well suited for the study of mutation rate variation. We find that the autocorrelation coefficient decays to a value close to zero by approximately 15 Mb, with little apparent variation in mutation rate under 100 kb. We conclude that the primary scale over which mutation rates vary is subchromosomal. Furthermore, our analysis shows that within-chromosome mutational variability exceeds variation among chromosomes by approximately one order of magnitude. Thus, differences in mutation rate between different regions of the same chromosome frequently exceed differences both between whole autosomes and between autosomes and the X-chromosome. Our results indicate that factors other than the time spent in the male germ line are important in driving mutation rates. This raises questions about the biological mechanism(s) that produce new mutations and has implications for the study of male-driven evolution.


Figures

Figure 1.
Figure 1.
Proportion of total sequence per mouse chromosome contributed by each repeat class.
Figure 2.
Figure 2.
Estimated average nucleotide substitution rates at all sites and non-CpG-prone sites for each mouse chromosome. Bars show the 95% bootstrap confidence intervals.
Figure 3.
Figure 3.
Autocorrelation of nucleotide substitution rates in ancestral repeats (A,B,C) and ancestral repeat flanking sequence (D) across 5-kb (A) and 100-kb (B,C,D) blocks. Substitution rates were estimated at all sites. Dotted lines show the upper and lower bounds of the 95% confidence interval of autocorrelation under the null hypothesis of no dependence of rates between blocks. Blocks were permuted randomly (A,B) and within common GC-content intervals (C,D).
Figure 4.
Figure 4.
Partial autocorrelation of nucleotide substitution rates in ancestral repeats (A) and flanking sequences (B). Substitution rates are estimated for all sites. Dotted lines show the upper and lower bounds of the 95% confidence interval of partial autocorrelation under the null hypothesis of no dependence of rates between blocks.
Figure 5.
Figure 5.
Between-block variation (σ2b) in substitution rates within ancestral repeats (A) and flanking sequence (B). Substitution rates are estimated at all sites. Between-block variances are estimated fitting the chromosome as a fixed effect and the block as a random effect across different block sizes, from 25 kb to 125 Mb. Block sizes are plotted on a log10 scale. The 95% confidence intervals of the between-block variance were as estimated by the lme routine of the nlme package in R. The Akaike Information Criterion (AIC) is shown for each fitted model.
Figure 6.
Figure 6.
The relationship between mouse–rat divergence and the mouse recombination rate average across 5-Mb windows. The equation of the regression line shown was estimated as y = 0.144 – 0.002x.

References

    1. Altschul, S.F., Madden, T.L., Schaffer, A.A., Zhang, J.H., Zhang, Z., Miller, W., and Lipman, D.J. 1997. Gapped BLAST and PSI-BLAST: A new generation of protein database search programs. Nucleic Acids Res. 25: 3389–3402. - PMC - PubMed
    1. Arndt, P.F., Burge, C.B., and Hwa, T. 2003. DNA sequence evolution with neighbor-dependent mutation. J. Comput. Biol. 10: 313–322. - PubMed
    1. Bailey, J.A., Carrel, L., Chakravarti, A., and Eichler, E.E. 2000. Molecular evidence for a relationship between LINE-1 elements and X chromosome inactivation: The Lyon repeat hypothesis. Proc. Natl. Acad. Sci. 97: 6634–6639. - PMC - PubMed
    1. Bejerano, G., Pheasant, M., Makunin, I., Stephen, S., Kent, W.J., Mattick, J.S., and Haussler, D. 2004. Ultraconserved elements in the human genome. Science 304: 1321–1325. - PubMed
    1. Box, G.E.P., Jenkins, G.M., and Reinsel, G.C. 1994. Time series analysis: Forecasting and control, 3rd ed. Prentice-Hall, Upper Saddle River, NJ.

Web site references

    1. http://www.repeatmasker.org/; the program RepeatMasker is available for download from this site.

Publication types

LinkOut - more resources