

Human ribosomal RNA gene arrays display a broad range of palindromic structures
- PMID: 16024823
- PMCID: PMC1182220
- DOI: 10.1101/gr.3970105
Human ribosomal RNA gene arrays display a broad range of palindromic structures
Abstract
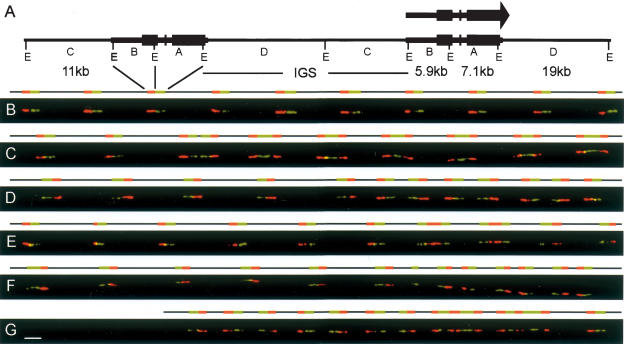
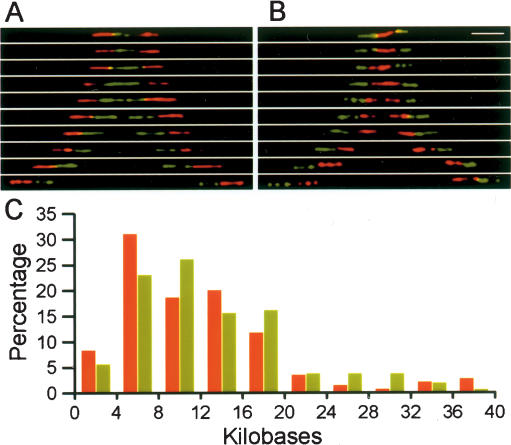
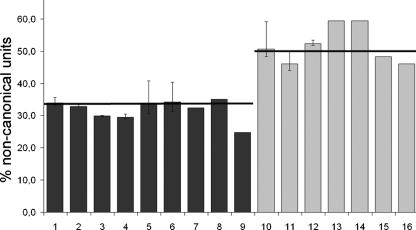
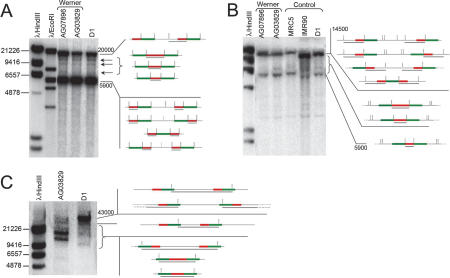
The standard model of eukaryotic ribosomal RNA (rRNA) genes involves tandem arrays with hundreds of units in clusters, the nucleolus organizer regions (NORs). A first genomic overview for human cells is reported here for these regions, which have never been sequenced in their totality, by using molecular combing. The rRNA-coding regions are examined by fluorescence on single molecules of DNA with two specific probes that cover their entire length. The standard organization assumed for rDNA units is a transcribed region followed by a nontranscribed spacer. While we confirmed this arrangement in many cases, unorthodox patterns were also observed in normal individuals, with one-third of the rDNA units rearranged to form apparently palindromic structures (noncanonical units) independent of the age of the donors. In cells from individuals with a deficiency in the WRN RecQ helicase (Werner syndrome), the proportion of palindromes increased to one-half. These findings, supported by Southern blot analyses, show that rRNA genes are a mosaic of canonical and (presumably nonfunctional) palindromic units that may be altered by factors associated with genomic instability and pathology.
Figures
Similar articles
-
DNA replication origin plasticity and perturbed fork progression in human inverted repeats.Mol Cell Biol. 2005 Aug;25(15):6789-97. doi: 10.1128/MCB.25.15.6789-6797.2005. Mol Cell Biol. 2005. PMID: 16024811 Free PMC article.
-
Active human nucleolar organizer regions are interspersed with inactive rDNA repeats in normal and tumor cells.Epigenomics. 2015;7(3):363-78. doi: 10.2217/epi.14.93. Epigenomics. 2015. PMID: 26077426
-
Divergent location of ribosomal genes in chromosomes of fish thorny-headed worms, Pomphorhynchus laevis and Pomphorhynchus tereticollis (Acanthocephala).Genetica. 2007 Oct;131(2):141-9. doi: 10.1007/s10709-006-9124-3. Epub 2006 Dec 2. Genetica. 2007. PMID: 17143651
-
The ribosomal RNA genes of Tetrahymena: structure and function.Eur J Cell Biol. 1985 Jan;36(1):133-51. Eur J Cell Biol. 1985. PMID: 3884336 Review.
-
[Functional analysis of yeast homologue gene associated with human DNA helicase causative syndromes].Kokuritsu Iyakuhin Shokuhin Eisei Kenkyusho Hokoku. 2002;(120):53-74. Kokuritsu Iyakuhin Shokuhin Eisei Kenkyusho Hokoku. 2002. PMID: 12638184 Review. Japanese.
Cited by
-
The Ribosomal Gene Loci-The Power behind the Throne.Genes (Basel). 2021 May 18;12(5):763. doi: 10.3390/genes12050763. Genes (Basel). 2021. PMID: 34069807 Free PMC article. Review.
-
The epigenetic regulator SIRT7 guards against mammalian cellular senescence induced by ribosomal DNA instability.J Biol Chem. 2018 Jul 13;293(28):11242-11250. doi: 10.1074/jbc.AC118.003325. Epub 2018 May 4. J Biol Chem. 2018. PMID: 29728458 Free PMC article.
-
A unique enhancer boundary complex on the mouse ribosomal RNA genes persists after loss of Rrn3 or UBF and the inactivation of RNA polymerase I transcription.PLoS Genet. 2017 Jul 17;13(7):e1006899. doi: 10.1371/journal.pgen.1006899. eCollection 2017 Jul. PLoS Genet. 2017. PMID: 28715449 Free PMC article.
-
Human SLX4 is a Holliday junction resolvase subunit that binds multiple DNA repair/recombination endonucleases.Cell. 2009 Jul 10;138(1):78-89. doi: 10.1016/j.cell.2009.06.029. Cell. 2009. PMID: 19596236 Free PMC article.
-
Basic mechanisms in RNA polymerase I transcription of the ribosomal RNA genes.Subcell Biochem. 2013;61:211-36. doi: 10.1007/978-94-007-4525-4_10. Subcell Biochem. 2013. PMID: 23150253 Free PMC article. Review.
References
-
- Arnheim, N. and Southern, E.M. 1977. Heterogeneity of the ribosomal genes in mice and men. Cell 11: 363–370. - PubMed
-
- Batzer, M.A. and Deininger, P.L. 2002. Alu repeats and human genomic diversity. Nat. Rev. Genet. 3: 370–379. - PubMed
-
- Bensimon, A., Simon, A., Chiffaudel, A., Croquette, V., Heslot, F., and Bensimon, D. 1994. Alignment and sensitive detection of DNA by a moving interface. Science 265: 2096–2098. - PubMed
-
- Bird, A. 2002. DNA methylation patterns and epigenetic memory. Genes & Dev. 16: 6–21. - PubMed
-
- Caburet, S. 2002. Structure mosaïque et instabilité de l'ADN ribosomal humain: Implications dans la sénescence et la cancérogènese. Ph.D. thesis, Université de Paris VII, Paris, France.
Publication types
MeSH terms
Substances
LinkOut - more resources
Full Text Sources
Other Literature Sources
Research Materials