. 2005 Aug;8(8):1022-7.
doi: 10.1038/nn1508. Epub 2005 Jul 17.

Ephrin-As and neural activity are required for eye-specific patterning during retinogeniculate mapping

Affiliations

Ephrin-As and neural activity are required for eye-specific patterning during retinogeniculate mapping

Cory Pfeiffenberger et al. Nat Neurosci. 2005 Aug.

Abstract

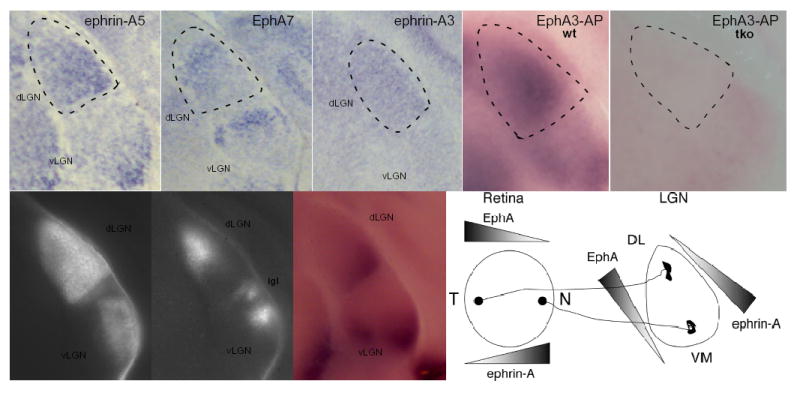
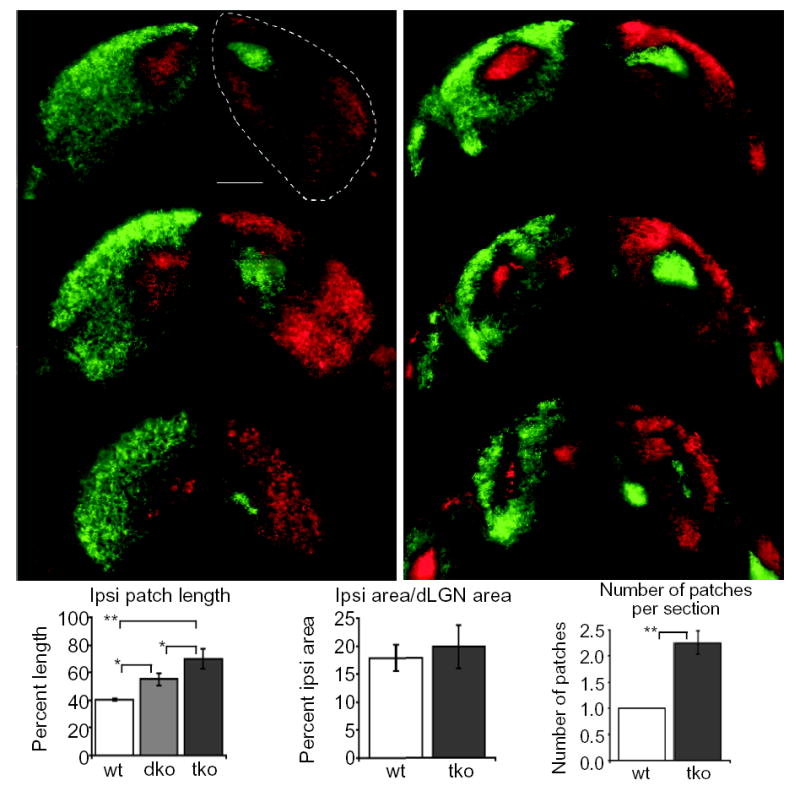
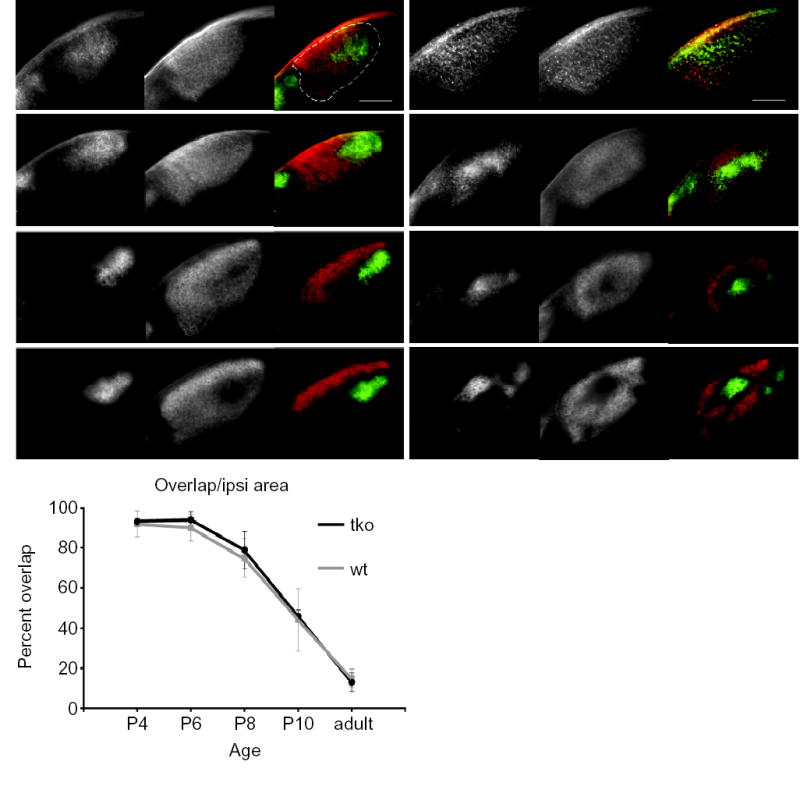
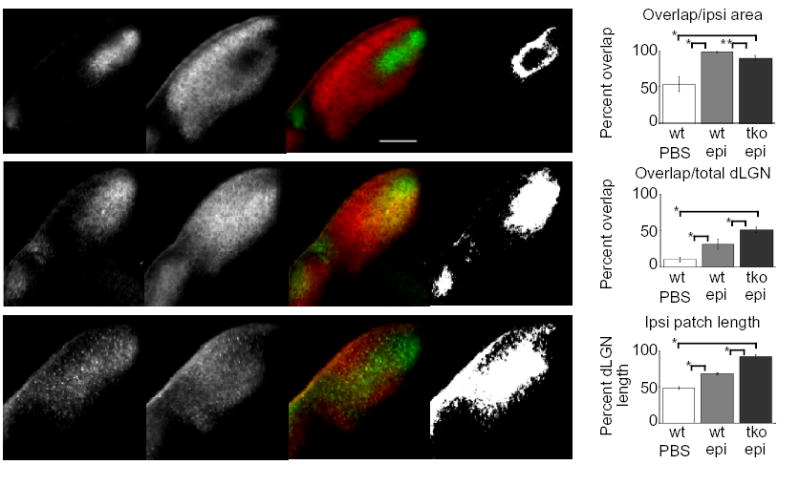
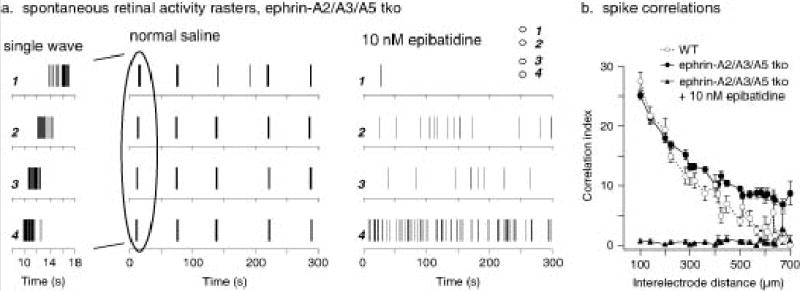
In mammals, retinal ganglion cell (RGC) projections initially intermingle and then segregate into a stereotyped pattern of eye-specific layers in the dorsal lateral geniculate nucleus (dLGN). Here we found that in mice deficient for ephrin-A2, ephrin-A3 and ephrin-A5, eye-specific inputs segregated but the shape and location of eye-specific layers were profoundly disrupted. In contrast, mice that lacked correlated retinal activity did not segregate eye-specific inputs. Inhibition of correlated neural activity in ephrin mutants led to overlapping retinal projections that were located in inappropriate regions of the dLGN. Thus, ephrin-As and neural activity act together to control patterning of eye-specific retinogeniculate layers.


Figures

Fig. 1
Fig. 1
Expression of EphA receptors and ephrin-A ligands in the developing mouse visual system. (a–c) Coronal sections of mouse P0 brain were treated with RNA hybridization probes for ephrin-A5 (a), EphA7 (b), and ephrin-A3 (c). (d,e) Total ephrin-A ligand expression in the developing thalamus consists of ephrin-A2, ephrin-A3, and ephrin-A5. Coronal sections were stained with EphA3-AP (to detect ephrin-A ligands) in wild-type (d), or ephrin-A2/A3/A5 triple mutants (e) at P0. Ephrin-As are expressed in gradients across the whole dLGN at these early time points. (f,g) Grey scale photomicrographs of coronal sections at P6 after injection of cholera toxin B-Alexa Fluor 594 or cholera toxin B-Alexa Fluor 488 into left and right eyes respectively showing the retinal axons from contralateral (f) and ipsilateral (g) eyes projecting into the dLGN. (h) The same section treated with EphA3-AP to detect ephrin-A ligands in the LGN at P6 showing ephrin-A expression becomes localized to ventral-lateral regions of the dLGN, which will become innervated only by contralateral inputs. No staining was ever seen when alternate sections were stained with AP alone. (i) Schematic of EphA receptor and ephrin-A ligand in the retina and dLGN during early periods of visual mapping. dLGN, dorsal lateral geniculate nucleus; vLGN, ventral lateral geniculate nucleus; igl, inter geniculate layer. N, nasal; T, temporal; VM, ventral-medial; DL, dorsal-lateral; wt, wild-type; tko, ephrin-A2/A3/A5 triple knockout. Dotted lines denote the approximate boundary of the dLGN. Dorsal is to the top, medial is to the left.
Fig. 2
Fig. 2
Defects in eye-specific layer placement but not in eye-specific segregation in ephrin-A2/A3/A5 triply mutant mice. Axons from the right eye are shown in green, axons from the left eye are shown in red. (a,b) A series of coronal sections from anterior (top) to posterior (bottom) showing left and right dLGN in representative adult (a) wild-type (wt) and (b) ephrin-A2/A3/A5 triple knockout (tko) mice. (c) Distribution of ipsilateral axon location within the dLGN. Data are expressed as a percentage of dLGN length along the longest DM-VL axis in coronal sections from wild-type, ephrin-A2/A5 doubly mutant (dko) and ephrin-A2/A3/A5 tko mice, showing that the location of eye-specific inputs is defective in ephrin mutants. (d) Quantification of the ratio of percent ipsilateral projection area to total dLGN area in wild-type and ephrin-A2/A3/A5 tko mice showing no significant difference in ipsilateral projection amounts between these two populations of mice. (e) Quantification of the average number of ipsilateral patches seen in a coronal section. A comparison of wild-type and ephrin-A2/A3/A5 tko mice shows that the ipsilateral projection in the dLGN is patchy in ephrin tko mice. Dotted lines show the outline of the dLGN. (* P< 0.001,**P<<0.001, ANOVA test.) (n= mice analyzed; wild-type n=3 (4 sections each from 3 mice), ephrin-A2/A5 mutant n=8 (4 sections each from 8 mice), ephrin-A2/A3/A5 mutant n=9 (4 sections each from 9 mice). Scale bar = 200μm. Dorsal is to the top.
Fig. 3
Fig. 3
Time course of eye-specific segregation in wild-type and ephrin-A2/A3/A5 tko mice. (a–h) Photomicrographs of 200μm-thick coronal sections showing the retinal projections from each eye projecting into the dLGN in wild-type (a,c,e,g) and ephrin-A2/A3/A5 tko (b,d,f,h) mice at P4 (a,b), P6 (c,d), P8 (e,f) and P10 (g,h). Each set of three images represents, from left to right: the ipsilateral projection, the contralateral projection and the merged image of one dLGN. Dorsal is to the top, medial is to the right in each image. The scale bar represents 200μm. Dotted line shows the outline of the dLGN. (i) Graphical representation of the percent of the ipsilateral area in which contralateral projections are also present (“overlap”), comparing wild-type and ephrin-A2/A3/A5 mutant mice at P4, P6, P8, P10, and adult. Error bars represent one standard deviation in either direction. (wild-type P4, P6, P10: n=4 mice (16 dLGN sections); wild-type P8, adult, tko P4, P6, P8, P10, adult: n=3 mice (12 dLGN sections).
Fig. 4
Fig. 4
Area of dLGN overlap is increased in epibatidine-treated ephrin-A2/A3/A5 mutant mice as compared to epibatidine-treated wild-type mice. (a–c) Photomicrographs of 150μm thick coronal dLGN sections from P9 wild-type (a, b) and ephrin-A2/A3/A5 mutant mice (c) that received binocular intravitreal epibatidine injections (b, c) or PBS control injections (a) every 24 hours from P3 to P7. The pictures are shown in groups of four representing, from left to right: the ipsilateral projection, the contralateral projection, the merged image and a binary image representing dLGN area with overlapping ipsilateral and contralateral projections. Dorsal is to the top, medial is to the right. The scale bar is 200μm. (d) Quantitative comparison of ipsilateral and contralateral axonal overlap between control (wt PBS), wild-type (wt epi), and ephrin-A2−/−A3−/−A5−/− or ephrin-A2−/−A3+/−A5−/− (tko epi) mutant mice, presented as the percentage of the ipsilateral area containing overlapping contralateral projections. (e) Quantitative comparison of ipsilateral and contralateral axonal overlap between control, wild-type and ephrin-A2−/−A3−/−A5−/− plus ephrin-A2−/−A3+/−A5−/− mutant mice, presented as the percentage of the total dLGN area containing overlap. (f) Quantitative comparison of the ipsilateral patch length between control, wild-type, and ephrin-A2−/−A3−/−A5−/− (or ephrin-A2−/−A3+/−A5−/−) mutant mice, expressed as the percentage of the dLGN length covered by the ipsilateral patch along the DM-VL axis. (* P << 0.001; ** P < 0.005, ANOVA test) (wt+PBS, wt+Epi: n=4 mice (16 dLGN sections); ephrin-A2−/−A3−/−A5−/− plus ephrin-A2−/−A3+/−A5−/−+Epi: n=4 mice (2 of each genotype, 16 dLGN sections).
Fig. 5
Fig. 5
Spontaneous retinal waves in ephrin-A2/A3/A5 mutant retinas. (a) Spike rasters of spontaneous retinal activity from an ephrin A2/A3/A5 triple knockout (tko) mouse at P4. Activity at single ganglion cells occurs in bursts followed by long periods of silence. Recording on a multielectrode array shows that these bursts occur across the retina in waves. Relative electrode positions (1 – 4) for the example neuron recordings are illustrated in the inset of the right panel. Closer examination of a typical wave (left panel, 10 sec) shows it traveling from electrode 4 to 1 at 140 μm/sec. In contrast, the activity of the same neurons in the presence of 10 nM epibatidine shows no waves. (b) Correlation indices were calculated for all pairs of neurons recorded from a P4 wild-type retina (white circles), a P4 ephrinA2/A3/A5 tko retina (black circles), and an epibatidine treated ephrin-A2/A3/A5 tko retina (black triangles). These are plotted against the distance between the electrodes from which the neuron’s spikes were recorded. In both the wild-type and ephrin A2/A3/A5 tko retinas, wave activity led to high correlation indices at small distances and lower ones at larger distances. Ephrin A2/A3/A5 tko retinas had a higher level of correlation at the largest distances in the array (approximately 800 μm) than the wild-type retinas, due to waves that were somewhat broader. Epibatidine, which eliminated the wave activity but did not eliminate spike activity in the ephrin A2/A3/A5 tko retina, abolished correlated activity at all distances. Wild-type n=3 retinas, ephrin-A2/A3/A5 n=3 retinas.

References

    1. Feldheim DA, et al. Genetic analysis of ephrin-A2 and ephrin-A5 shows their requirement in multiple aspects of retinocollicular mapping. Neuron. 2000;25:563–574. - PubMed
    1. Feldheim DA, et al. Topographic guidance labels in a sensory projection to the forebrain. Neuron. 1998;21:1303–1313. - PubMed
    1. Feldheim DA, et al. Loss-of-function analysis of EphA receptors in retinotectal mapping. J Neurosci. 2004;24:2542–50. - PMC - PubMed
    1. Vanderhaeghen P, Polleux F. Developmental mechanisms patterning thalamocortical projections: intrinsic, extrinsic and in between. Trends Neurosci. 2004;27:384–91. - PubMed
    1. McLaughlin T, Hindges R, O'Leary DD. Regulation of axial patterning of the retina and its topographic mapping in the brain. Curr Opin Neurobiol. 2003;13:57–69. - PubMed

Publication types