

Whole-genome analysis of human influenza A virus reveals multiple persistent lineages and reassortment among recent H3N2 viruses
- PMID: 16026181
- PMCID: PMC1180517
- DOI: 10.1371/journal.pbio.0030300
Whole-genome analysis of human influenza A virus reveals multiple persistent lineages and reassortment among recent H3N2 viruses
Abstract
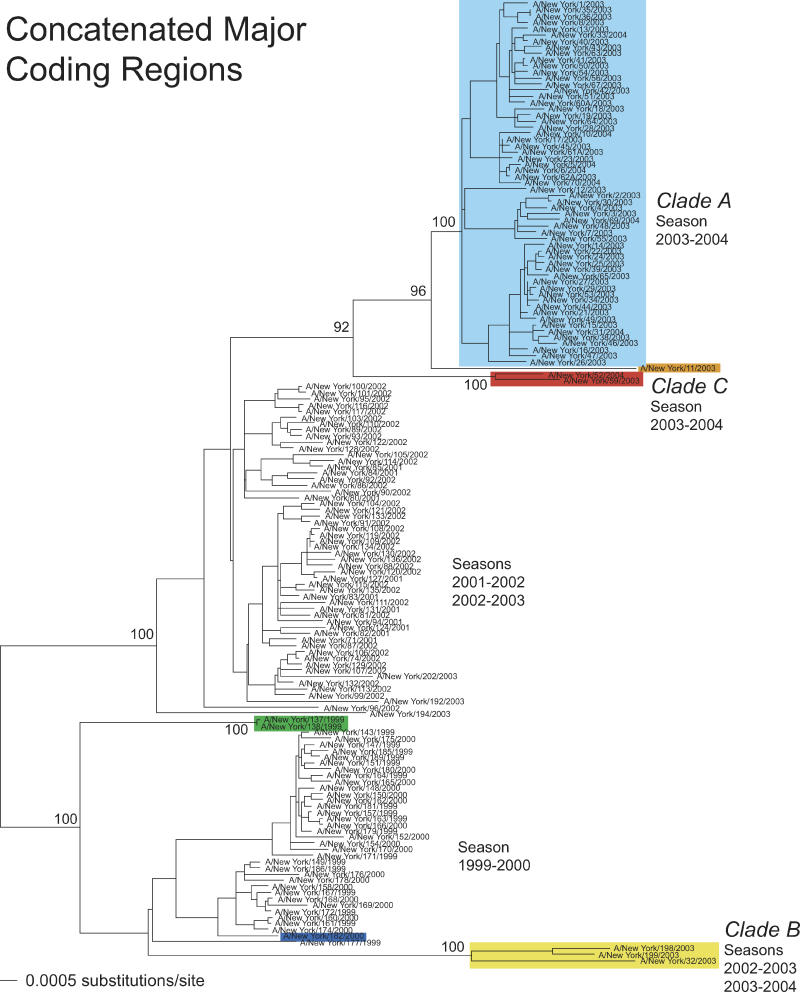
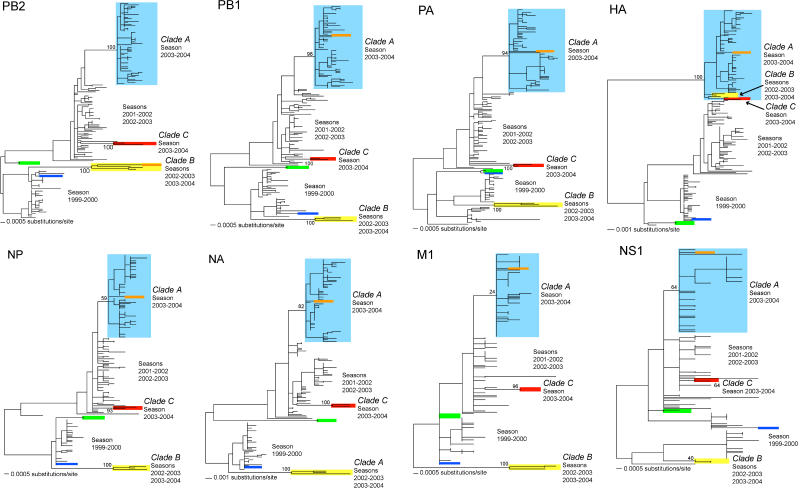
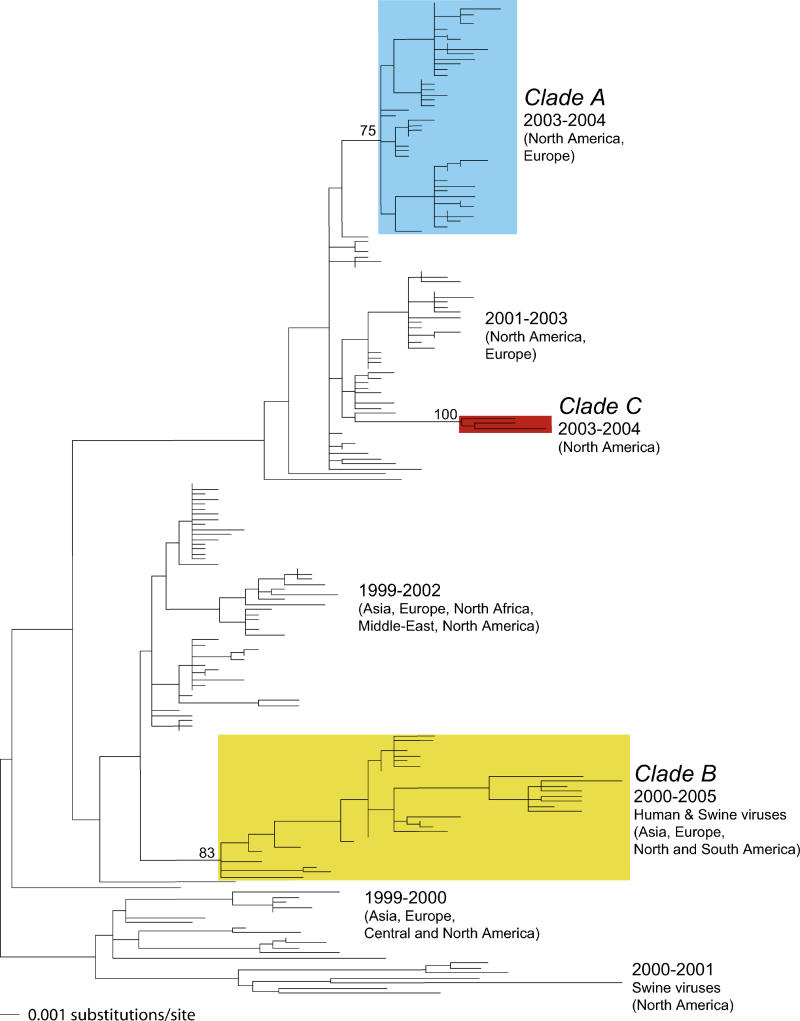
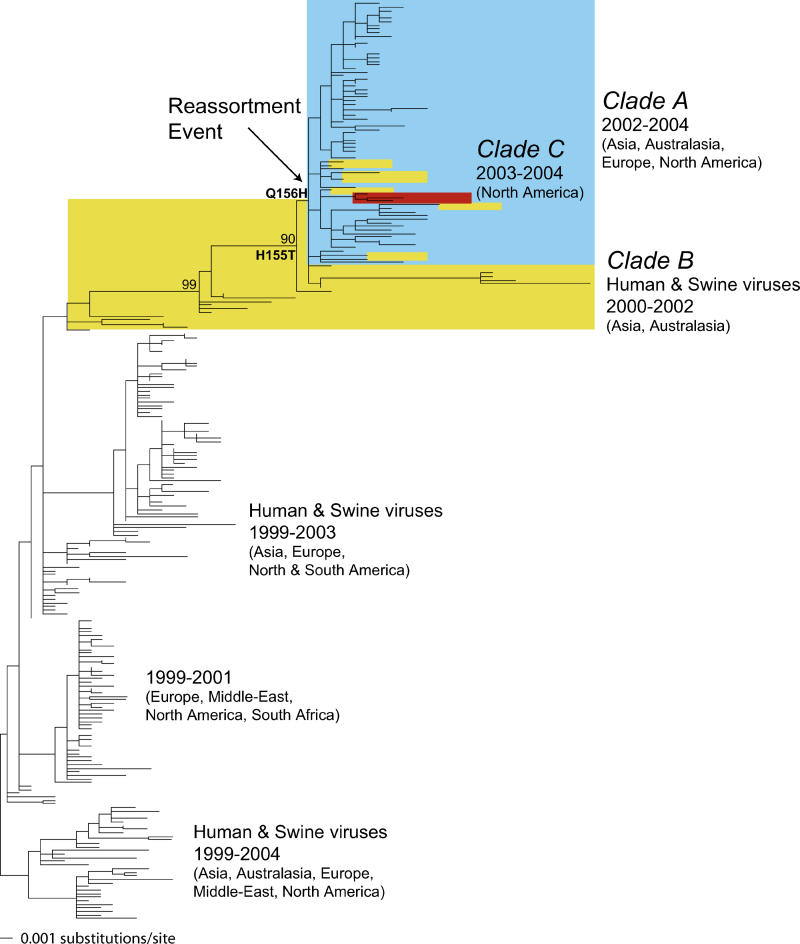
Understanding the evolution of influenza A viruses in humans is important for surveillance and vaccine strain selection. We performed a phylogenetic analysis of 156 complete genomes of human H3N2 influenza A viruses collected between 1999 and 2004 from New York State, United States, and observed multiple co-circulating clades with different population frequencies. Strikingly, phylogenies inferred for individual gene segments revealed that multiple reassortment events had occurred among these clades, such that one clade of H3N2 viruses present at least since 2000 had provided the hemagglutinin gene for all those H3N2 viruses sampled after the 2002-2003 influenza season. This reassortment event was the likely progenitor of the antigenically variant influenza strains that caused the A/Fujian/411/2002-like epidemic of the 2003-2004 influenza season. However, despite sharing the same hemagglutinin, these phylogenetically distinct lineages of viruses continue to co-circulate in the same population. These data, derived from the first large-scale analysis of H3N2 viruses, convincingly demonstrate that multiple lineages can co-circulate, persist, and reassort in epidemiologically significant ways, and underscore the importance of genomic analyses for future influenza surveillance.
Figures
References
-
- Cox NJ, Subbarao K. Global epidemiology of influenza: Past and present. Annu Rev Med. 2000;51:407–421. - PubMed
-
- Simonsen L, Fukuda K, Schonberger LB, Cox NJ. The impact of influenza epidemics on hospitalizations. J Infect Dis. 2000;181:831–837. - PubMed
-
- Thompson WW, Shay DK, Weintraub E, Brammer L, Cox N. Mortality associated with influenza and respiratory syncytial virus in the United States. JAMA. 2003;289:179–186. - PubMed
-
- Webby RJ, Webster RG. Are we ready for pandemic influenza? Science. 2003;302:1519–1522. - PubMed
Publication types
MeSH terms
Grants and funding
LinkOut - more resources
Full Text Sources
Other Literature Sources
