Comparative Study
. 2005 Jun;21(12):3447-52.
doi: 10.1111/j.1460-9568.2005.04170.x.

Anterior cingulate error-related activity is modulated by predicted reward

Affiliations
Comparative Study

Anterior cingulate error-related activity is modulated by predicted reward

Céline Amiez et al. Eur J Neurosci. 2005 Jun.

Abstract

Learning abilities depend on detection and exploitation of errors. In primates, this function involves the anterior cingulate cortex. However, whether anterior cingulate error-related activity indicates occurrence of inappropriate responses or results from other computations is debated. Here we have tested whether reward-related parameters modulate error-related activity of anterior cingulate neurons. Recordings in monkeys performing stimulus-reward associations and preliminary data obtained with a problem-solving task revealed major properties of error-related unit activity: (i) their amplitude varies with the amount of predicted reward or the proximity to reward delivery; (ii) they appear both after execution and performance errors; (iii) they do not indicate which error occurred or which correction to make; and (iv), importantly, the activity of these neurons also increases following an external signal indicating the necessity to shift response. Hence, we conclude that anterior cingulate 'error' activity might represent a negative deviation from a predicted goal, and does not only reflect error detection but signals events interrupting potentially rewarded actions.


Figures
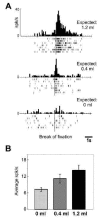
Fig. 1
Fig. 1
Experiment 1. Error-Related activity is modulated by expected reward size. (A) PSTHs, for one cell, aligned on detection of break fixation, for each amount of expected reward. (B) Average population ER activity measured at the peak epoch (12 cells). Main effect of expected reward size: ANOVA, F(2.290)=8.66; p<0.0002.
Fig. 2
Fig. 2
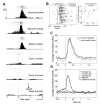
Experiment 2. ER activity during the problem-solving task. (A) PSTHs for one ER cell, aligned on different events: all incorrect touches, signal to change sequence, break of fixation, and correct touches. (B) Saccades and start of burst are presented for incorrect touch trials for the cell presented in A. On the right, the plot shows higher variability for latencies between saccade (triangles on rasters) and the start of burst (circle) than for latencies calculated from touch times. F-test on variances revealed 3 cells with no significant differences (at p<0.05). (C) Average normalized activity for the 15 ER cells. The graph shows error activity aligned on incorrect touches (1st and 2nd together – black) and on break of fixation occurring after 5.5s from the beginning of a trial (dashed grey). (D) Activity aligned on reward, first, second, and third correct touches in correct sequences, and on the Signal of sequence change (smoothing of average curve: Lowess method). Average activity was measured at the peak epoch (bold grey line on x axis in ‘C’).
Fig. 3
Fig. 3
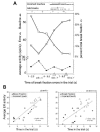
Experiment 2. Effect of distance to reward on ER activity. (A) Most break fixation errors occurred in the early phases of trials (open squares). Fewer occurred near the end of trials. The average normalized error response for the 15 cells followed the reverse evolution (grey discs). Average baseline (before the error) is represented (black rectangles). On top, the average times with standard errors are represented together with individual values (dots) for all incorrect touches (empty diamond – 7.2±1.3s) and late break fixation errors (grey disc – 6.9±1.2s). White numbered triangles represent the average time of touches during trials (on average 6.27s and 8.56s for incorrect first (1) and second (2) touches respectively). Time period effect: baseline: F(6;513) = 1.08, p = 0.3707; error signal: F(6;513) = 5.45, p = 0.00002. (B) Two cells which activity measured at the time of either break of fixation or incorrect touches, is plotted against the time of occurrence of the error in the trial. For both the correlation coefficient is statistically significant (p<0.001).

References

    1. Amiez C, Procyk E, Honore J, Sequeira H, Joseph JP. Reward anticipation, cognition, and electrodermal activity in the conditioned monkey. Exp Brain Res. 2003;149:267–275. - PubMed
    1. Brooks VB. How does the limbic system assist motor learning? a limbic comparator hypothesis. Brain Behav Evol. 1986;29:29–53. - PubMed
    1. Brown JW, Braver TS. Learned predictions of error likelihood in the anterior cingulate cortex. Science. 2005;307:1118–1121. - PubMed
    1. Fiorillo CD, Tobler PN, Schultz W. Discrete coding of reward probability and uncertainty by dopamine neurons. Science. 2003;299:1898–1902. - PubMed
    1. Gehring WJ, Goss B, Coles MG, Meyer DE, Donchin E. A neural system for error detection and compensation. Psychol Sci. 1993;4:385–390.

Publication types