. 2005 Jul 15;6 Suppl 2(Suppl 2):S11.
doi: 10.1186/1471-2105-6-S2-S11.

Microarray scanner calibration curves: characteristics and implications

Affiliations

Microarray scanner calibration curves: characteristics and implications

Leming Shi et al. BMC Bioinformatics. .

Abstract

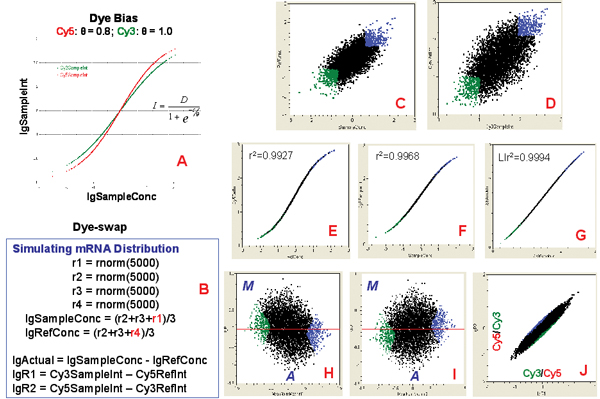
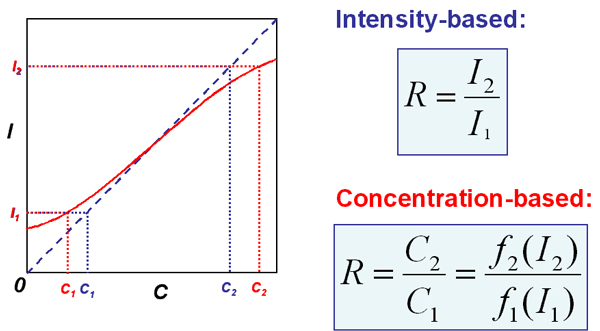
Background: Microarray-based measurement of mRNA abundance assumes a linear relationship between the fluorescence intensity and the dye concentration. In reality, however, the calibration curve can be nonlinear.

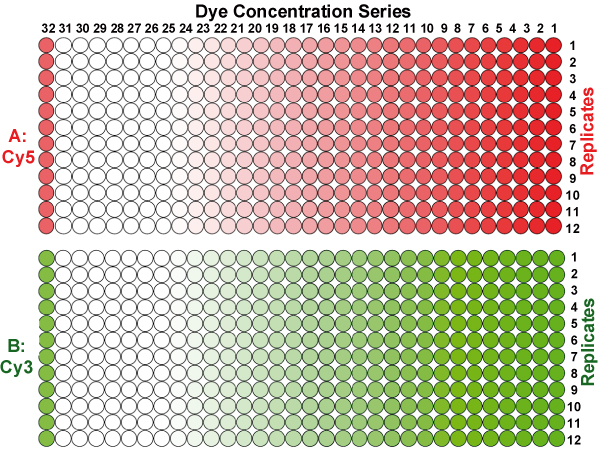
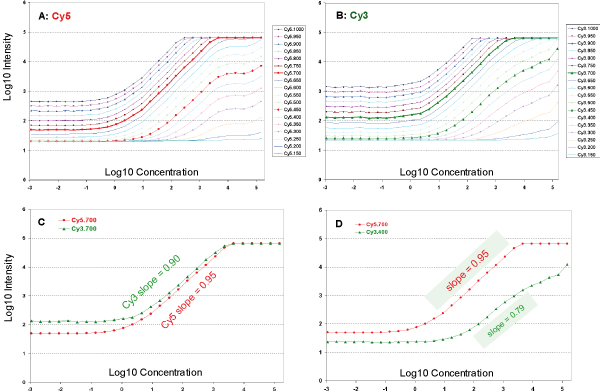
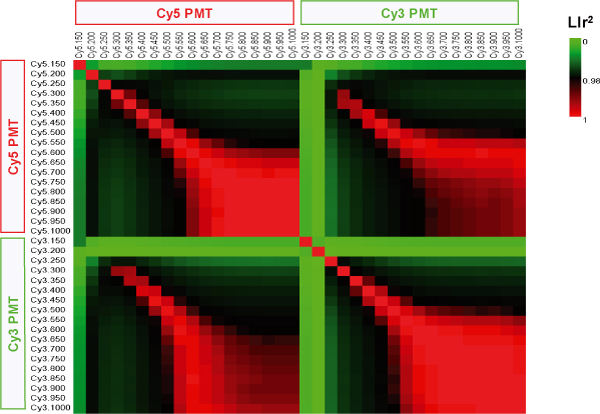
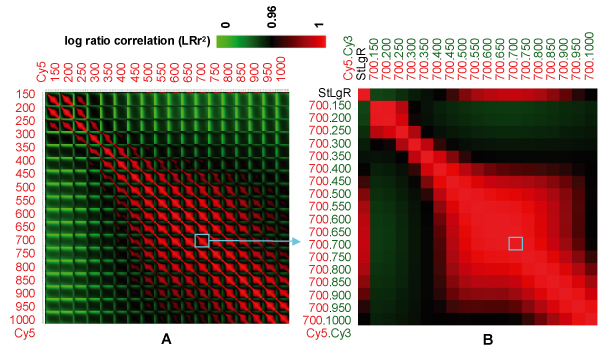
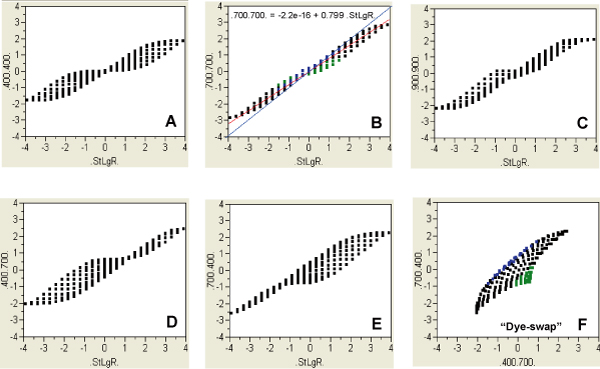
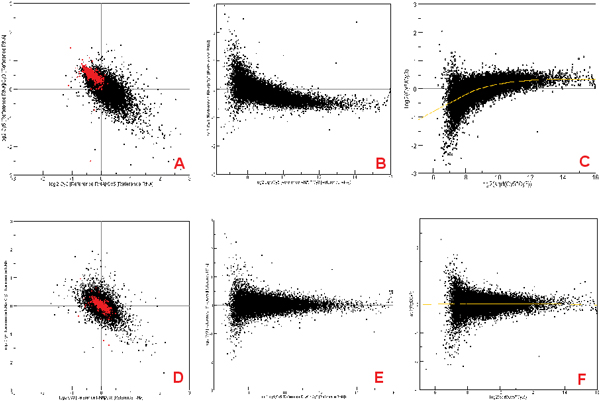
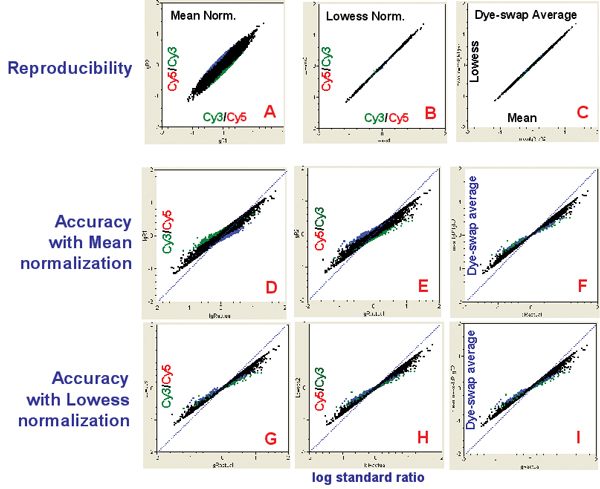
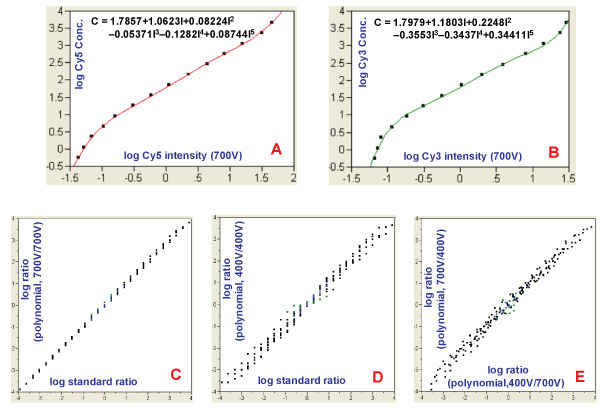
Results: By scanning a microarray scanner calibration slide containing known concentrations of fluorescent dyes under 18 PMT gains, we were able to evaluate the differences in calibration characteristics of Cy5 and Cy3. First, the calibration curve for the same dye under the same PMT gain is nonlinear at both the high and low intensity ends. Second, the degree of nonlinearity of the calibration curve depends on the PMT gain. Third, the two PMTs (for Cy5 and Cy3) behave differently even under the same gain. Fourth, the background intensity for the Cy3 channel is higher than that for the Cy5 channel. The impact of such characteristics on the accuracy and reproducibility of measured mRNA abundance and the calculated ratios was demonstrated. Combined with simulation results, we provided explanations to the existence of ratio underestimation, intensity-dependence of ratio bias, and anti-correlation of ratios in dye-swap replicates. We further demonstrated that although Lowess normalization effectively eliminates the intensity-dependence of ratio bias, the systematic deviation from true ratios largely remained. A method of calculating ratios based on concentrations estimated from the calibration curves was proposed for correcting ratio bias.

Conclusion: It is preferable to scan microarray slides at fixed, optimal gain settings under which the linearity between concentration and intensity is maximized. Although normalization methods improve reproducibility of microarray measurements, they appear less effective in improving accuracy.


Figures

Figure 1
Figure 1
The layout of a microarray scanner calibration slide. A: Cy5 block; B: Cy3 block. There are 384 (32 by 12) spots for each of the Cy5 or Cy3 block. Series 1 to 28 correspond to two-fold dilutions, each of which has 12 repeats. Series 29 to 31 are blanks and series 32 is the positioning marker.
Figure 2
Figure 2
Calibration curves under different PMT gains. X-axis: log10 concentration, Y-axis: log10 fluorescence intensity. A: Cy5 dye; B: Cy3 dye. Representative calibration curves are presented in C (Cy5 and Cy3 channels are scanned under the same PMT gain of 700 V) and D (the Cy5 and Cy3 channels are scanned at 700 V and 400 V, respectively). The range of linear response between dye concentration and fluorescence intensity depends on the PMT gain, so does the slope of the linear response range. There is also a difference between Cy5 and Cy3 in terms of the spread and slope of the linear range. Each data point represents the averaged log intensity of the 12 repeats with the same dye concentration.
Figure 3
Figure 3
Reproducibility of log intensities. This is a color-image presentation of a 36 by 36 square matrix. Each square block represents the squared Pearson correlation coefficient of log intensities (LIr2) for two series of intensity data scanned at two PMT settings. The diagonal represents self-self correlation. Red color means higher correlation, whereas green indicates lower correlation. Only 14 concentration series are used in the calculation of LIr2.
Figure 4
Figure 4
Reproducibility of log ratios. A: Correlation matrix for 324 pairs of Cy5/Cy3 gains; B: Correlation matrix for Cy5 gain at 700 V and 18 gains for Cy3. StLgR refers to the standard log ratios calculated from the spotted Cy5 and Cy3 concentrations on the scanner calibration slide.
Figure 5
Figure 5
Accuracy and underestimation of log ratios. The correlation of true log ratios (StLgR) versus log ratios estimated by fluorescence intensities under different combinations of Cy5/Cy3 PMT gain settings reveals systematic ratio bias. Intensity data are mean-zero normalized for each individual channel at each PMT gain. The log ratios are estimated from different Cy5/Cy3 PMT gain combinations; A: 400 V/400 V; B: 700 V/700 V; C: 900 V/900 V; D: 400 V/700 V; and E: 700 V/400 V. Figure 5E corresponds to a dye-swap pair in which the Cy5/Cy3 PMT gains are set to 400 V/700 V and 700 V/400 V for the X- and Y-axes, respectively.
Figure 6
Figure 6
Experimentally observed anti-correlation of log ratios for dye-swap replicates. A: Anti-correlation of dye-swap replicates (self-self hybridizations) before Lowess normalization; B and C: MA plots for dye-swap pair before Lowess normalization; D: Correlation of dye-swap replicates after Lowess normalization; E and F: MA plots for dye-swap pair after Lowess normalization. Spots colored in red are of higher average intensity.
Figure 7
Figure 7
Simulation of the characteristics of dye-swap replicates. A: Dye bias is simulated by a difference in θ of the Sigmoid function; B: Dye-swap pairing; C: log mRNA concentrations for the two samples ("Sample" and "Ref"); D: Scatter plot of log intensities for one replicate of the dye-swap pair; E: Calibration curve for Cy5 ("labeled" with "Ref"); F: Calibration curve for Cy3 ("labeled" with "Sample"); G: log intensity correlation for the same sample ("Sample") labeled with two dyes in the dye-swap pair; H: MA plot for "Ref" labeled with Cy5 and "Sample" labeled with Cy3; I: MA plot for "Ref" labeled with Cy3 and "Sample" labeled with Cy5; J: log ratio correlation of the dye-swap pair. Spots colored in green are of lower average intensity, whereas spots colored in blue are of higher average intensity.
Figure 8
Figure 8
Effect of normalization on the reproducibility and accuracy of log ratios (simulated data). A: log ratio correlation of dye-swap pair after mean normalization; B: log ratio correlation of dye-swap pair after Lowess normalization; C: Correlation of averaged log ratios of dye-swap pairs after mean and Lowess normalization. For D-I, the X-axis represents the log standard ratios directly calculated from concentrations. The Y-axis is represented as follows: D and E: log ratios for dye-swap pair (after mean normalization); F: Averaged log ratios of dye-swap pair (after mean normalization); G and H: log ratios for dye-swap pair (after Lowess normalization); I: Averaged log ratios of dye-swap pair (after Lowess normalization). Spots colored in green are of lower average intensity, whereas spots colored in blue are of higher average intensity.
Figure 9
Figure 9
Intensity-and concentration-based ratio calculation. Intensity-based ratio calculation is accurate only when the calibration curve (I~C) is a linear and pass the origin (the dashed blue line). When the calibration curve is nonlinear (red curve), intensity-based ratio calculation underestimate the true concentration differences. Such an underestimation of concentration difference is universal for both two-color and one-color platforms. For one-color platform, the calibration functions f1 and f2 are the same, whereas for two-color platform, f1 and f2 reflect the differences of the two dyes as discussed in this study.
Figure 10
Figure 10
Correction of ratio bias by calculating ratios from the estimated concentrations from the calibration curves. A: Polynomial fitting of c = f(I) for Cy5 at 700 V gain; B: Polynomial fitting of c = f(I) for Cy3 at 700 V gain; C: log standard ratios versus log ratios calculated from concentrations estimated from the calibration curves (Cy5/Cy3 PMT gains at 700 V/700 V); D: log standard ratios versus log ratios calculated from concentrations estimated from the calibration curves (Cy5/Cy3 PMT gains at 400 V/400 V); E: log ratios calculated from concentrations estimated from the calibration curves under Cy5/Cy3 PMT gains at 400 V/700 V and 700 V/400 V, respectively. Data were from the scanner calibration slide. The effectiveness of concentration-based ratio calculation is more obvious by comparing Figures 10C, 10D and 10E to Figures 5B, 5A and 5F, respectively.

References

    1. Yue H, Eastman PS, Wang BB, Minor J, Doctolero MH, Nuttall RL, Stack R, Becker JW, Montgomery JR, Vainer M, et al. An evaluation of the performance of cDNA microarrays for detecting changes in global mRNA expression. Nucleic Acids Res. 2001;29:E41–41. doi: 10.1093/nar/29.8.e41. - DOI - PMC - PubMed
    1. Hoffman EP. Expression profiling – best practices for data generation and interpretation in clinical trials. Nat Rev Genet. 2004;5:229–237. doi: 10.1038/nrg1297. - DOI - PubMed
    1. Shi L, Tong W, Goodsaid F, Frueh FW, Fang H, Han T, Fuscoe JC, Casciano DA. QA/QC: challenges and pitfalls facing the microarray community and regulatory agencies. Expert Rev Mol Diagn. 2004;4:761–777. doi: 10.1586/14737159.4.6.761. - DOI - PubMed
    1. Cheung VG, Morley M, Aguilar F, Massimi A, Kucherlapati R, Childs G. Making and reading microarrays. Nat Genet. 1999;21:15–19. doi: 10.1038/4439. - DOI - PubMed
    1. Pickett S. Understanding and evaluating fluorescent microarray imaging instruments. IVT Technology. 2003;9:1–6.

Publication types

MeSH terms

LinkOut - more resources