

Processing methods for differential analysis of LC/MS profile data
- PMID: 16026613
- PMCID: PMC1187873
- DOI: 10.1186/1471-2105-6-179
Processing methods for differential analysis of LC/MS profile data
Abstract
Background: Liquid chromatography coupled to mass spectrometry (LC/MS) has been widely used in proteomics and metabolomics research. In this context, the technology has been increasingly used for differential profiling, i.e. broad screening of biomolecular components across multiple samples in order to elucidate the observed phenotypes and discover biomarkers. One of the major challenges in this domain remains development of better solutions for processing of LC/MS data.
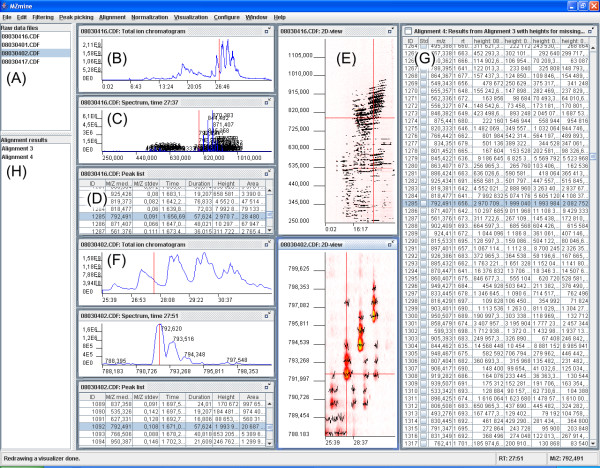
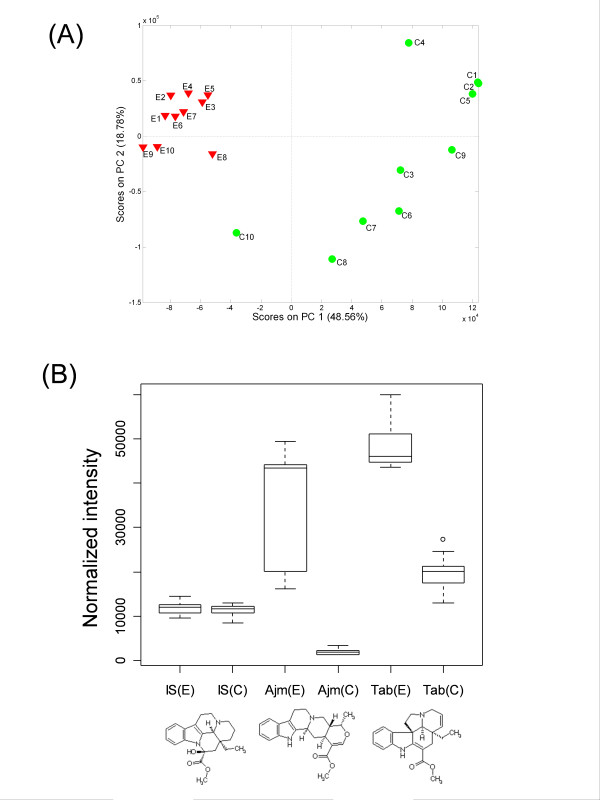
Results: We present a software package MZmine that enables differential LC/MS analysis of metabolomics data. This software is a toolbox containing methods for all data processing stages preceding differential analysis: spectral filtering, peak detection, alignment and normalization. Specifically, we developed and implemented a new recursive peak search algorithm and a secondary peak picking method for improving already aligned results, as well as a normalization tool that uses multiple internal standards. Visualization tools enable comparative viewing of data across multiple samples. Peak lists can be exported into other data analysis programs. The toolbox has already been utilized in a wide range of applications. We demonstrate its utility on an example of metabolic profiling of Catharanthus roseus cell cultures.
Conclusion: The software is freely available under the GNU General Public License and it can be obtained from the project web page at: http://mzmine.sourceforge.net/.
Figures


References
-
- Ardrey RE. Liquid chromatography - mass spectrometry: An introduction. , John Wiley & Sons; 2003.
-
- de Hoffmann E, Stroobant V. Mass spectrometry: Principles and applications. 2. , John Wiley & Sons; 2001.
-
- van der Greef J, Davidov E, Verheij E, Vogels JTWE, van der Heijden R, Adourian AS, Oresic M, Marple EW, Naylor S. The role of metabolomics in systems biology: A new vision for drug discovery and development. In: Harrigan GG and Goodacre R, editor. Metabolic profiling: Its role in biomarker discovery and gene function analysis. Boston, Mass., Kluwer Academic Publishers; 2003. pp. 171–198.
Publication types
MeSH terms
LinkOut - more resources
Full Text Sources
Other Literature Sources
Molecular Biology Databases
