Comparative Study
. 2005 Jul;7(7):678-87.
doi: 10.1593/neo.04757.

Continuous low-dose (metronomic) chemotherapy on rat prostate tumors evaluated using MRI in vivo and comparison with histology

Affiliations
Comparative Study

Continuous low-dose (metronomic) chemotherapy on rat prostate tumors evaluated using MRI in vivo and comparison with histology

Dawen Zhao et al. Neoplasia. 2005 Jul.

Abstract

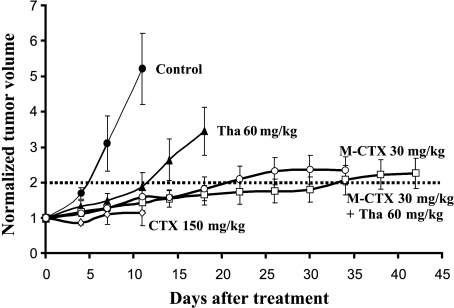
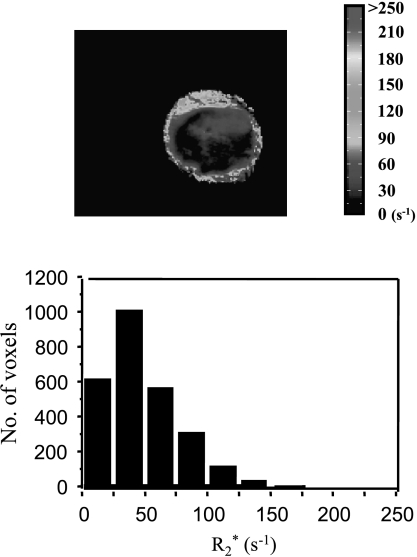
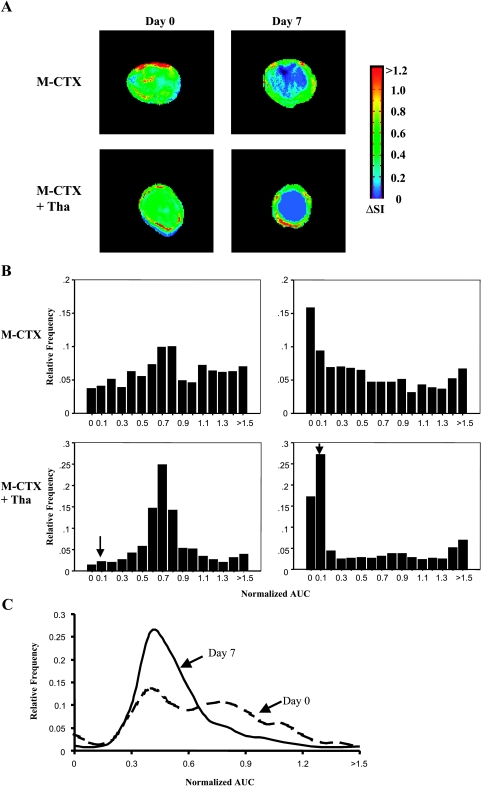
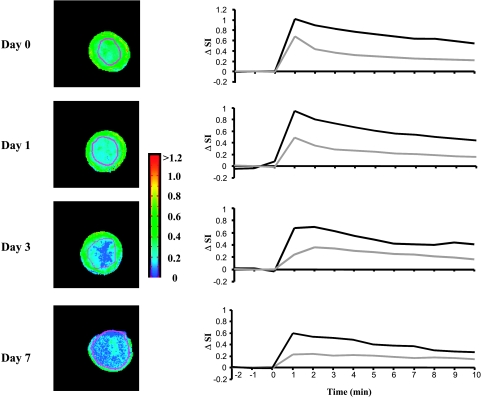
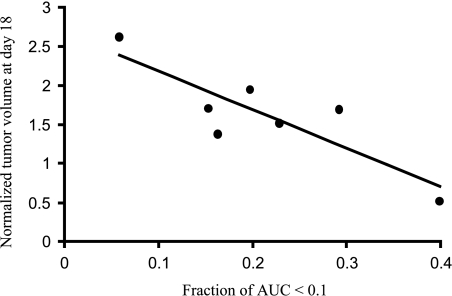
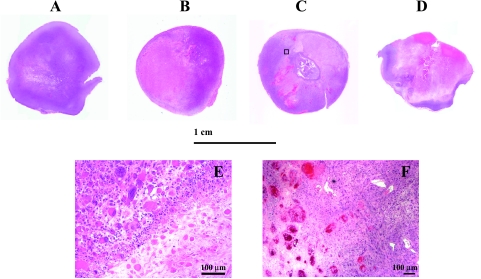
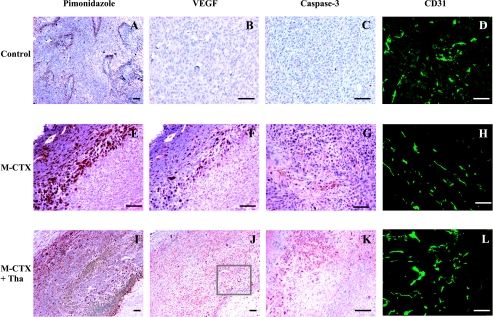
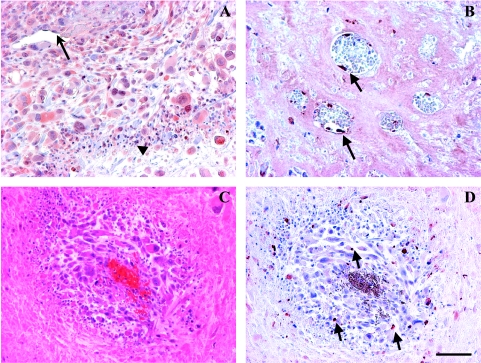
Continuous low-dose (metronomic) therapy, based on cyclophosphamide (CTX) combined with thalidomide (Tha), was evaluated on Dunning prostate R3327-AT1 rat tumors. Significantly delayed tumor growth (P < .001) was observed with oral CTX alone at a low dose (metronomic cyclophosphamide or M-CTX; 30 mg/kg per day) or combined with Tha. To investigate dynamic changes in tumor physiology during early stages of treatment, magnetic resonance imaging (MRI) was applied before and during the M-CTX or M-CTX + Tha therapy. Dynamic contrast-enhanced MRI revealed significant changes in the tumor center by day 3 (P < .01); by day 7, only a thin peripheral tumor region showed high signal enhancement. There was a significant correlation between poorly enhancing fraction on day 7 and ultimate tumor growth delay (P < .02). The apparent transverse relaxation rate (R2*) showed similar baseline tumor heterogeneity, but no obvious changes with growth or therapy. Histology confirmed substantial necrosis in the tumor center, leaving a thin live peripheral rim. Immunohistochemistry showed a significant increase in vascular endothelial growth factor, and apoptotic tumor and vascular endothelial cells. These results show the efficacy of the metronomic CTX +/- Tha for delaying tumor growth and indicate that MRI provides insights into the mode of action and early indication of efficacy.


Figures

Figure 1
Figure 1
Tumor growth with respect to treatment. Treatment started on the established AT1 tumors with an average volume of 0.6 cm3 (day 0) and normalized mean tumor volumes (±SE) are shown for each treatment group. Group 1 (●, control), Group 2 (▲, Tha alone), Group 3 (◊, MTD CTX). All six animals treated with a standard MTD of CTX (150 mg/kg, i.p., twice per week) died after three doses on or before day 12. Group 4a (◯, M-CTX), Group 5a (□, M-CTX + Tha). M-CTX = metronomic cyclophosphamide given orally in drinking water.
Figure 2
Figure 2
The R2* map and distribution histogram obtained from a representative tumor on day 0 showed significant heterogeneity. R2* ranged from 4.5 to 326 second-1 (mean = 51 second-1).
Figure 3
Figure 3
(A) Signal enhancement (ΔSI) maps at 60 seconds after infusion of Gd-DTPA-BMA observed from DCE MR images from the central slice of representative tumors before (day 0, left) and during treatment (day 7, right). Top row: The M-CTX-treated tumor (subgroup 4b—volumes: day 0 = 0.9 cm3, day 7 = 1.0 cm3). Bottom row: The M-CTX + Tha-treated tumor (subgroup 5a—volumes: day 0 = 0.7 cm3, day 7 = 0.4 cm3). In both of the tumors, significant signal enhancement after intravenous injection of Gd-DTPA-BMA was seen in the whole section on day 0. However, only a peripheral rim with highly enhancing signal remained on day 7. (B) Normalized AUC frequency histograms obtained from the three slices of the same tumors showed a significant left shift following therapy (AUC < 0.1, P < .001). The bins labeled with (↓) indicate an AUC of 0.0001 to 0.1. (C) Histograms of a control tumor showed much less shift.
Figure 4
Figure 4
Dynamic change in signal intensity-time curve of DCE MRI in a M-CTX + Tha-treated tumor (also shown in Figure 2). T1-weighted images (left column) showed that the area with lower signal enhancement (blue) progressively increased with time. Like the tumor shown in Figure 3A, the majority of tumor showed little or no increase in signal enhancement on day 7. Signal versus time curves (right column) revealed differential behavior between peripheral (dark line) and central (light line) tumor regions observed by DCE MRI.
Figure 5
Figure 5
A significant correlation (r = 0.85, P < .02) was found between normalized tumor volume on day 18 and the fraction of poorly DCE-enhancing tumor (AUC < 0.1) on day 7 in the seven M-CTX + Tha-treated (group 5a) tumors.
Figure 6
Figure 6
H&E staining of whole mount sections of M-CTX- and M-CTX + Tha-treated tumors, compared with a size-matched control tumor (A). For the M-CTX-treated (B) and M-CTX + Tha-treated (C) tumors, a large central necrosis was obvious on day 7; only a very thin rim with viable tissue was seen on day 42 of the M-CTX + Tha tumor (D). Enlarged image (x10) for the area selected from (C) shows a border region between the necrotic and viable tissues (E). Significant increase in the size of nuclei and cells indicates an inhibition of tumor mitosis. An increased number of vascular thromboses was identified in the tumors treated with M-CTX + Tha (F). Bar: 100 µm.
Figure 7
Figure 7
After 7 days of treatment, immunohistology showed a significant increase in tumor hypoxia, VEGF expression, and apoptosis in both the M-CTX-treated (middle, E–G) and the M-CTX + Tha-treated (bottom, I–K) tumors, compared with untreated controls (top, A–C). There was no significant change in MVD (D versus H versus L). Colocalization of tumor hypoxia and VEGF expression in the M-CTX-treated (E and F) and M-CTX + Tha-treated (I and J) tumors was seen in the two adjacent tissue sections. Bar: 100 µm.
Figure 8
Figure 8
M-CTX + Tha-induced elevated VEGF and endothelial apoptosis. A region of VEGF staining enlarged from Figure 6A (A). The positive VEGF staining was detected in tumor cells (cytoplasm and nuclei), vascular endothelium (arrow), and infiltrated inflammatory cells (arrow head). Detached endothelial cells from basement membrane were positively stained for apoptosis using anti-active caspase-3 (arrow) (B). A typical perivascular cuff was seen in regions surrounding an embolized microvessel resulting in tumor necrosis outside the cuff (C) and apoptosis in the cuff (arrows) (D). Bar: 100 µm.

References

    1. Browder T, Butterfield CE, Kraling BM, Shi B, Marshall B, O'Reilly MS, Folkman J. Antiangiogenic scheduling of chemotherapy improves efficacy against experimental drug-resistant cancer. Cancer Res. 2000;60:1878–1886. - PubMed
    1. Klement G, Baruchel S, Rak J, Man S, Clark K, Hicklin DJ, Bohlen P, Kerbel RS. Continuous low-dose therapy with vinblastine and VEGF receptor-2 antibody induces sustained tumor regression without over toxicity. J Clin Invest. 2000;105:R15–R24. - PMC - PubMed
    1. Man S, Bocci G, Francia G, Green SK, Jothy S, Hanahan D, Bohlen P, Hicklin DJ, Bergers G, Kerbel RS. Antitumor effects in mice of low-dose (metronomic) cyclophosphamide administered continuously through drinking water. Cancer Res. 2002;62:2731–2735. - PubMed
    1. Hermans IF, Chong TW, Palmowski MJ, Harris AL, Cerundolo V. Synergistic effect of metronomic dosing of cyclophosphamide combined with specific antitumor immunotherapy in a murine melanoma model. Cancer Res. 2003;63:8408–8413. - PubMed
    1. Colleoni M, Rocca A, Sandri MT, Zorzino L, Masci G, Nole F, Peruzzotti G, Robertson C, Orlando L, Cinieri S, et al. Low-dose oral methotrexate and cyclophosphamide in metastatic breast cancer: antitumor activity and correlation with vascular endothelial growth factor levels. Ann Oncol. 2002;13:73–80. - PubMed

Publication types