. 2005 Jul 18;202(2):309-19.
doi: 10.1084/jem.20050569.

CD4-CD8- T cells control intracellular bacterial infections both in vitro and in vivo

Affiliations

CD4-CD8- T cells control intracellular bacterial infections both in vitro and in vivo

Siobhán C Cowley et al. J Exp Med. .

Abstract

Memory T cells, including the well-known CD4(+) and CD8(+) T cells, are central components of the acquired immune system and are the basis for successful vaccination. After infection, CD4(+) and CD8(+) T cells expand into effector cells, and then differentiate into long-lived memory cells. We show that a rare population of CD4(-)CD8(-)CD3(+)alphabeta(+)gammadelta(-)NK1.1(-) T cells has similar functions. These cells potently and specifically inhibit the growth of the intracellular bacteria Mycobacterium tuberculosis (M. tb.) or Francisella tularensis Live Vaccine Strain (LVS) in macrophages in vitro, promote survival of mice infected with these organisms in vivo, and adoptively transfer immunity to F. tularensis LVS. Furthermore, these cells expand in the spleens of mice infected with M. tb. or F. tularensis LVS, and then acquire a memory cell phenotype. Thus, CD4(-)CD8(-) T cells have a role in the control of intracellular infection and may contribute to successful vaccination.


Figures

Figure 1.
Figure 1.
Control of F. tularensis LVS and M. tb. macrophage intracellular growth by DN T cells in vitro. BMMØs from WT mice were infected with LVS at an MOI of 1:20 (bacterium/macrophage) or with M. tb. at an MOI of 1:100. Infected BMMØs were co-cultured with splenocytes from uninfected mice (naive spleen); splenocytes from C57BL/6J mice infected intradermally with LVS 4 wk earlier (a) or with M. tb. by aerosol 4 wk earlier (b, immune spleen); highly enriched DN T cells (prepared as described in Materials and methods) from LVS-immune or M. tb.–immune spleens; or no spleen cells (BMMØ + LVS or M. tb.). Immediately after infection of the BMMØs, splenocytes were added to the indicated wells at a ratio of 1:2 (splenocyte/BMMØ). 3 d (LVS) or 8 d (M. tb.) after infection, BMMØs were washed, lysed, and plated to determine the levels of intracellular bacteria. Values shown are the mean numbers of CFU/ml ± the SEM of viable bacteria (triplicate samples). Bacterial uptake by the BMMØs was determined to be log10 2.040 ± 0.154 CFU/ml (LVS) and 3.441 ± 0.200 CFU/ml (M. tb.) at time 0. These data are representative of eight (a) or five (b) experiments of similar design. *, P < 0.001 compared with co-cultures containing naive spleen cells. (c–f) Supernatants from triplicate samples obtained from LVS co-cultures (black bars) or M. tb. co-cultures (gray bars) immediately before macrophage lysis from the indicated cultures were assessed by ELISA for IL-12, IFN-γ, or TNF-α, or by Griess reaction as an indirect measure of NO. Values shown in panels c–e are mean pg/ml ± SEM of cytokine. Values shown in panel f are mean μmol/ml ± SEM of NO.
Figure 2.
Figure 2.
DN T cell specificity: assessment of the ability of DN T cells isolated from immune and nonimmune sources to control bacterial intracellular growth. Highly enriched DN T cells were prepared from LVS-immune, M. tb.–immune, L. monocytogenes–immune, or naive mice. The enriched DN T cell populations were co-cultured with BMMØs infected with either F. tularensis LVS (a) or M. tb. (b). Bacterial growth was determined as described in Fig. 1. Values shown are the mean numbers of CFU/ml ± the SEM of viable bacteria (triplicate samples). Bacterial uptake by the BMMØs was determined to be log10 1.318 ± 0.275 CFU/ml (LVS) and 2.448 ± 0.114 CFU/ml (M. tb.) at time 0. These data are representative of two experiments of similar design. *, P < 0.01 (a) and P < 0.05 compared with co-cultures containing naive spleen cells.
Figure 3.
Figure 3.
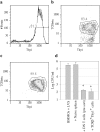
Highly purified LVS-immune DN T cells control the intracellular growth of F. tularensis LVS. Enriched DN T cells from LVS-immune mice were prepared as in Fig. 1. The resulting cells were labeled with a panel of fluorescently labeled antibodies to cell surface markers and further selected via flow sorting on the basis of their expression of both TCR β and Thy 1.2, as well as their lack of expression of CD4, CD8, TCR δ, NK1.1, B220, and CD11b. In this experiment, 81–83% of the enriched cells expressed Thy1.2 before sorting (a and b); after sorting, the purified cells were 99.6% positive for both TCR β and Thy1.2 (c). To compare the function of the enriched and purified DN T cells, these cells were co-cultured with LVS-infected BMMØs (d). BMMØ co-cultures contained splenocytes from either uninfected mice (naive spleen); highly enriched LVS-immune DN T cells (presort); DN T cells purified by flow sorting (TCRβ+Thy1+); or no spleen cells (BMMØ + LVS). Bacterial growth was determined as described in Fig. 1. Values shown are the mean numbers of CFU/ml ± the SEM of viable bacteria (triplicate samples). Bacterial uptake by the BMMØs was determined to be log10 1.52 ± 0.187 CFU/ml at time 0. *, P < 0.01 compared with co-cultures containing naive spleen cells.
Figure 4.
Figure 4.
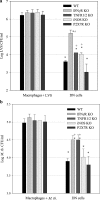
LVS or M. tb.–immune DN T cells control the intracellular growth of F. tularensis LVS and M. tb. in part by production of IFN-γ and TNF-α. BMMØs from WT mice, IFN-γR KO mice, TNFR 1/2 KO mice, iNOS KO mice, or P2X7R KO mice (as indicated by the respective shaded bars) were infected with LVS at an MOI of 1:20 (bacterium/macrophage) or with M. tb. at an MOI of 1:100. The indicated infected BMMØs were co-cultured with highly enriched WT DN T cells (prepared as described in Materials and methods) from LVS-immune spleens (a), M. tb.–immune spleens (b), or no spleen cells (a, BMMØ + LVS and b, BMMØ + M. tb.). 3 d (LVS) or 8 d (M. tb.) after infection, BMMØs were washed, lysed, and plated to determine the levels of intracellular bacteria. Values shown are the mean numbers of CFU/ml ± the SEM of viable bacteria (triplicate samples). LVS uptake by the different BMMØ monolayers at time 0 was as follows: log10 1.401 ± 0.174 CFU/ml (WT), log10 1.492 ± 0.199 CFU/ml (IFN-γR KO), log10 1.46 ± 0.151 CFU/ml (TNFR 1/2 KO), log10 1.360 ± 0.102 CFU/ml (iNOS KO), and log10 1.360 ± 0.318 CFU/ml (P2X7R KO). M. tb. uptake for the different BMMØ monolayers at time 0 was as follows: log10 3.367 ± 0.096 CFU/ml (WT), log10 3.390 ± 0.154 CFU/ml (IFN-γR KO), log10 3.284 ± 0.255 CFU/ml (TNFR 1/2 KO), log10 3.340 ± 0.297 CFU/ml (iNOS KO), and log10 3.465 ± 0.061 CFU/ml (P2X7R KO). In all cases, bacterial uptake in the KO BMMØs was not significantly different from their WT counterparts (P > 0.20). These data are representative of three (a and b) experiments of similar design. *, P < 0.05 compared with co-cultures containing macrophages + LVS; +, P < 0.05 compared with co-cultures containing DN T cells and WT BMMØs.
Figure 5.
Figure 5.
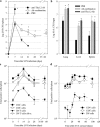
DN T cells contribute to control of bacterial infection in vivo and expand during the course of in vivo bacterial infection. To assess the contribution of DN T cells to primary infection, mice were treated with either PBS, a combination of antibodies designed to remove all T cells except DN T cells (anti-CD4, anti-CD8, anti-NK1.1, and anti–TCR γδ), or with anti-Thy1.2 to remove all T cells, and then infected with a sublethal i.d. dose of LVS (a) or by aerosol with M. tb. (b) Numbers of CFU in organs (n = 4) were assessed for bacterial burdens at the indicated time points (a), or 30 d after aerosol infection (b). In panel a, mice treated with anti-Thy1.2 died by day 11, precluding further analysis of that group. Values shown are mean numbers of CFU/ml ± the SEM of viable bacteria. *, P < 0.01 compared with CFUs in organs obtained from PBS-treated mice. To assess the status of responding DN T cells during primary infection, mice were infected with a sublethal i.d. dose of LVS (c) or with a low aerosol dose of M. tb. (d), and total numbers of the indicated T cell populations in spleens (±SEM) of four infected mice were assessed by flow cytometry for each time point. In panel c, the numbers of DN T cells in normal mice were also compared with the numbers in mice depleted of all other T cells before infection (Ab tx, antibody combination). These data are representative of three (a and c) or two (b and d) experiments of similar design. Black circles, numbers of CD4+ T cells; white circles, numbers of CD8+ T cells; black triangles, numbers of DN T cells in normal mice; white triangles, numbers of DN T cells in antibody combination–treated mice.
Figure 6.
Figure 6.
DN T cells acquire memory cell markers during primary sublethal LVS infection and transfer immunity to LVS in vivo. Mice infected with a sublethal i.d. dose of LVS were treated with a combination of antibodies designed to remove all T cells except DN T cells (anti-CD4, anti-CD8, anti-NK1.1, and anti–TCR γδ). Spleens were removed from naive mice (naive) or at the indicated time points after LVS infection. Splenocytes were labeled with a panel of fluorescent antibodies to cell surface markers and gated on the basis of their expression of Thy 1.2, as well as their lack of expression of CD4, CD8, TCR δ, NK1.1, B220, and CD11b. This gated DN T cell population was then further assessed by flow cytometry for expression of the memory cell markers IL-7Rα, CD62L, CD44, and CD45RB (a). The numbers represent the percentage of cells in each population that falls within the designated gate. Red lines, isotype control; black lines, antibody-specific staining. Similar results were observed using this flow cytometry analysis on mice not depleted before analyses. In panel b, enriched CD4+, CD8+, and DN T cells were prepared from LVS-immune mice (described in Materials and methods). Whole naive and LVS-immune splenocytes were also prepared, and 107 of each of these cell preparations were adoptively transferred i.p. to naive C57/BL6 mice. 2 h later, all mice were given a lethal 102 LVS i.p. challenge. Bacterial liver and spleen burdens were determined 3 d after infection and are represented as the mean numbers of CFU/organ ± the SEM of viable bacteria. The number of survivors/total mice for each group is also shown. These data are representative of three (a) or two (b) experiments of similar design. *, P < 0.01 compared with CFUs in organs obtained from mice given naive spleen.
Figure 6.
Figure 6.
DN T cells acquire memory cell markers during primary sublethal LVS infection and transfer immunity to LVS in vivo. Mice infected with a sublethal i.d. dose of LVS were treated with a combination of antibodies designed to remove all T cells except DN T cells (anti-CD4, anti-CD8, anti-NK1.1, and anti–TCR γδ). Spleens were removed from naive mice (naive) or at the indicated time points after LVS infection. Splenocytes were labeled with a panel of fluorescent antibodies to cell surface markers and gated on the basis of their expression of Thy 1.2, as well as their lack of expression of CD4, CD8, TCR δ, NK1.1, B220, and CD11b. This gated DN T cell population was then further assessed by flow cytometry for expression of the memory cell markers IL-7Rα, CD62L, CD44, and CD45RB (a). The numbers represent the percentage of cells in each population that falls within the designated gate. Red lines, isotype control; black lines, antibody-specific staining. Similar results were observed using this flow cytometry analysis on mice not depleted before analyses. In panel b, enriched CD4+, CD8+, and DN T cells were prepared from LVS-immune mice (described in Materials and methods). Whole naive and LVS-immune splenocytes were also prepared, and 107 of each of these cell preparations were adoptively transferred i.p. to naive C57/BL6 mice. 2 h later, all mice were given a lethal 102 LVS i.p. challenge. Bacterial liver and spleen burdens were determined 3 d after infection and are represented as the mean numbers of CFU/organ ± the SEM of viable bacteria. The number of survivors/total mice for each group is also shown. These data are representative of three (a) or two (b) experiments of similar design. *, P < 0.01 compared with CFUs in organs obtained from mice given naive spleen.

Similar articles

Cited by

References

    1. Flynn, J.L., and J. Chan. 2001. Immunology of tuberculosis. Annu. Rev. Immunol. 19:93–129. - PubMed
    1. Dennis, D.T., T.V. Inglesby, D.A. Henderson, J.G. Bartlett, M.S. Ascher, E. Eitzen, A.D. Fine, A.M. Friedlander, J. Hauer, M. Layton, et al. 2001. Tularemia as a biological weapon: medical and public health management. JAMA. 285:2763–2773. - PubMed
    1. Schaible, U.E., H.L. Collins, and S.H. Kaufmann. 1999. Confrontation between intracellular bacteria and the immune system. Adv. Immunol. 71:267–377. - PubMed
    1. Elkins, K.L., S.C. Cowley, and C.M. Bosio. 2003. Innate and adaptive immune responses to an intracellular bacterium, Francisella tularensis live vaccine strain. Microbes Infect. 5:135–142. - PubMed
    1. Yee, D., T.R. Rhinehart-Jones, and K.L. Elkins. 1996. Loss of either CD4+ or CD8+ T cells does not affect the magnitude of protective immunity to an intracellular pathogen, Francisella tularensis strain LVS. J. Immunol. 157:5042–5048. - PubMed

MeSH terms