. 2005 Jul 18;202(2):321-31.
doi: 10.1084/jem.20050338.

Toll-like receptor 9 controls anti-DNA autoantibody production in murine lupus

Affiliations

Toll-like receptor 9 controls anti-DNA autoantibody production in murine lupus

Sean R Christensen et al. J Exp Med. .

Abstract

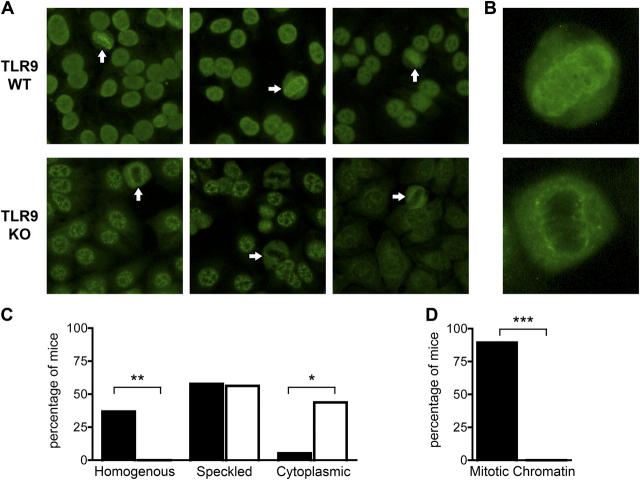
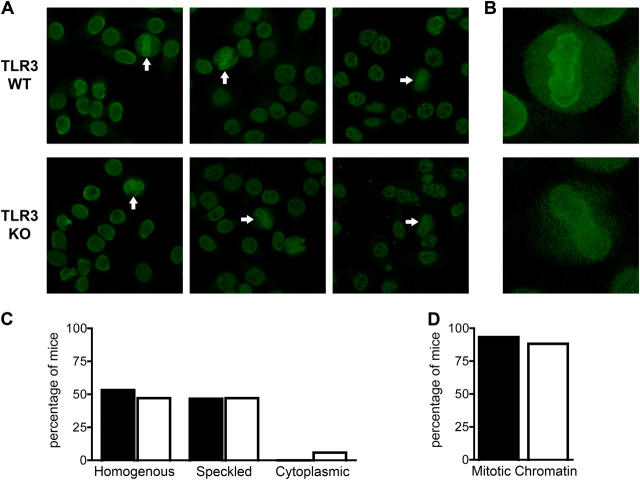
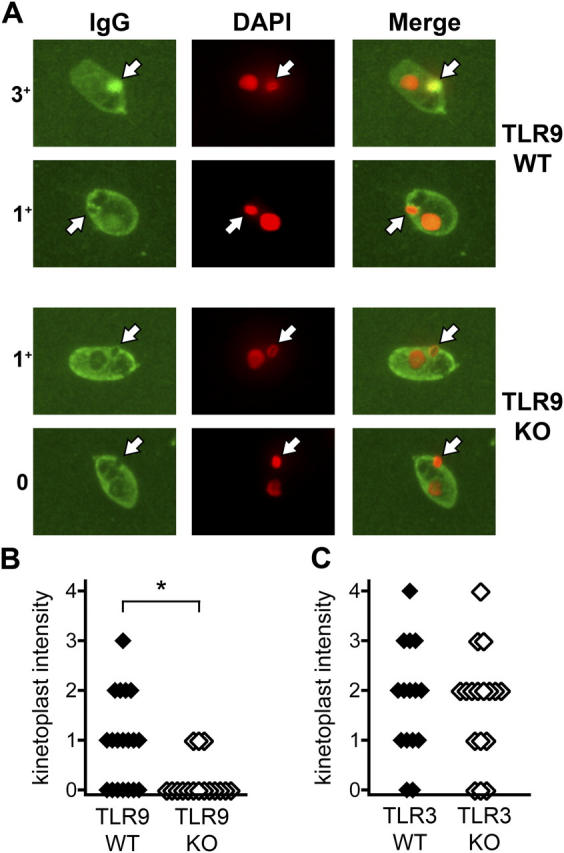
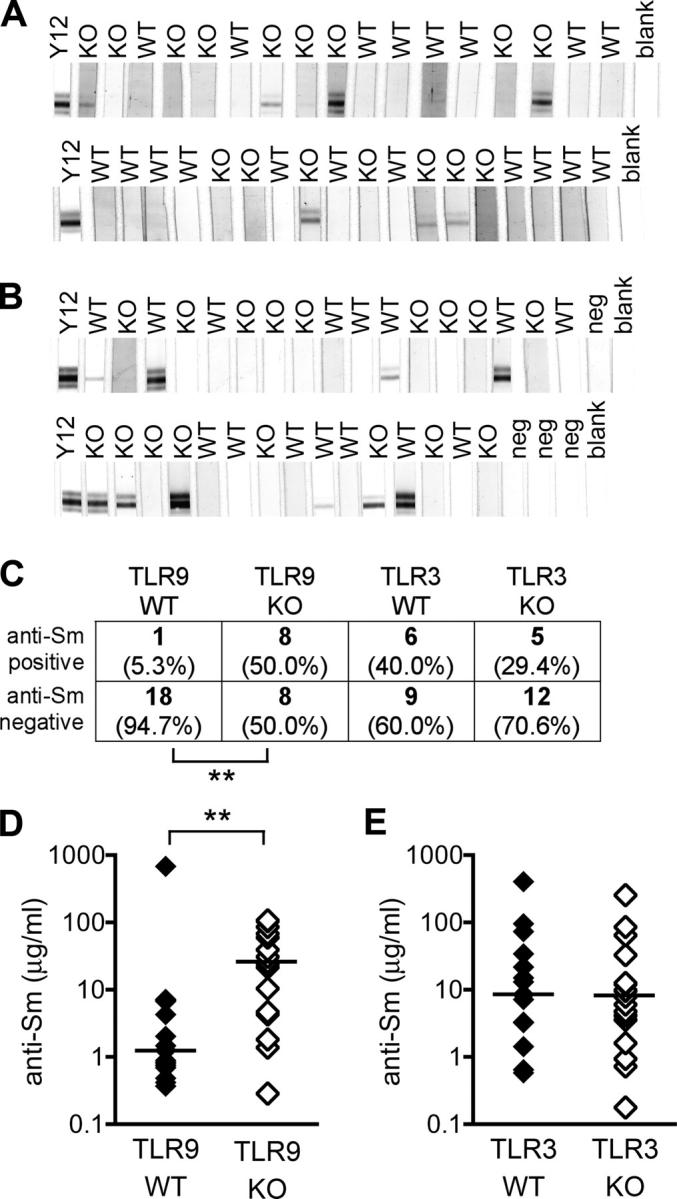
Systemic autoimmune disease in humans and mice is characterized by loss of immunologic tolerance to a restricted set of self-nuclear antigens. Autoantigens, such as double-stranded (ds) DNA and the RNA-containing Smith antigen (Sm), may be selectively targeted in systemic lupus erythematosus because of their ability to activate a putative common receptor. Toll-like receptor 9 (TLR9), a receptor for CpG DNA, has been implicated in the activation of autoreactive B cells in vitro, but its role in promoting autoantibody production and disease in vivo has not been determined. We show that in TLR9-deficient lupus-prone mice, the generation of anti-dsDNA and antichromatin autoantibodies is specifically inhibited. Other autoantibodies, such as anti-Sm, are maintained and even increased in TLR9-deficient mice. In contrast, ablation of TLR3, a receptor for dsRNA, did not inhibit the formation of autoantibodies to either RNA- or DNA-containing antigens. Surprisingly, we found that despite the lack of anti-dsDNA autoantibodies in TLR9-deficient mice, there was no effect on the development of clinical autoimmune disease or nephritis. These results demonstrate a specific requirement for TLR9 in autoantibody formation in vivo and indicate a critical role for innate immune activation in autoimmunity.


Figures

Figure 1.
Figure 1.
TLR9-deficient sera lack anti-DNA and antichromatin staining patterns. (A) ANAs were determined in sera (1:200) from 20-wk-old F2 mice. TLR9+/+ sera are shown at the top (left, homogenous pattern; middle and right, speckled pattern); TLR9−/− sera are shown at the bottom (left and middle, speckled pattern; right, cytoplasmic pattern). Some TLR9+/+ sera had predominantly speckled patterns superimposed on faint homogenous staining (middle). White arrows indicate cells in metaphase that demonstrate positive (top, TLR9+/+) or negative (bottom, TLR9−/−) chromatin staining. Original magnification, 400. (B) Digitally enlarged images of metaphase cells with positive (top, TLR9+/+) or negative (bottom, TLR9−/−) chromatin staining. (C) Serum ANAs were classified as nuclear homogenous, nuclear speckled, or cytoplasmic staining patterns. Black bars indicate TLR9+/+ sera (n = 19), and white bars indicate TLR9−/− sera (n = 16). (D) As in C, but serum ANAs were classified as either positive or negative for mitotic chromatin staining. *, P < 0.02; **, P < 0.01; and ***, P < 0.0001 by Fisher's exact test.
Figure 2.
Figure 2.
Unaltered ANA patterns in TLR3-deficient sera. (A) Serum ANAs were determined as in Fig. 1. TLR3+/+ sera are shown at the top (left, homogenous pattern; middle and right, speckled pattern); TLR3−/− sera are shown at the bottom (left, homogenous pattern; middle and right, speckled pattern). White arrows indicate cells in metaphase that demonstrate positive chromatin staining. Original magnification, 400. (B) Digitally enlarged images of metaphase cells with positive chromatin staining. (C) Serum ANAs were classified as nuclear homogenous, nuclear speckled, or cytoplasmic staining patterns. Black bars indicate TLR3+/+ sera (n = 15), and white bars indicate TLR3−/− sera (n = 17). (D) As in C, but serum ANAs were classified as either positive or negative for mitotic chromatin staining.
Figure 3.
Figure 3.
Reduced anti-dsDNA autoantibodies in TLR9/ but not TLR3/ mice. (A) Anti-dsDNA antibodies were detected by C. luciliae immunofluorescence. IgG antibodies to C. luciliae DNA are shown in green (left), and DAPI staining of DNA is shown in red (middle). White arrows indicate the kinetoplast. Specific anti-dsDNA antibodies are identified by colocalization of IgG and DAPI staining in the kinetoplast and appear in yellow (right). Representative TLR9+/+ sera are shown in the top two rows (intensity scores of 3+ and 1+), and TLR9−/− sera are shown in the bottom two rows (intensity scores of 1+ and 0). Original magnification, 1,000. (B and C) Specific anti-dsDNA staining of C. luciliae kinetoplasts was scored from 0 to 4 as in A for either TLR9+/+ (n = 19) and TLR9−/− (n = 16) sera (B), or TLR3+/+ (n = 15) and TLR3−/− (n = 17) sera (C). *, P < 0.02 by the Mann-Whitney U test.
Figure 4.
Figure 4.
Presence of anti-Sm autoantibodies in TLR-deficient mice. (A) Anti-Sm antibodies were detected by Western blot in TLR9+/+ (WT; n = 19) and TLR9−/− (KO; n = 16) sera. The monoclonal anti-Sm antibody Y12 was used as a positive control. Depicted portion of the gel is from 29–34 kD, corresponding to the B and B′ cluster of Sm proteins. (B) Anti-Sm antibodies were detected in TLR3+/+ (WT; n = 15) and TLR3−/− (KO; n = 17) sera as in A. Nonautoimmune control sera are also depicted (neg; n = 4). (C) Sera from TLR9 and TLR3 cohorts was scored as either positive or negative for anti-Sm antibodies by Western blot as in A and B. (D and E) Anti-Sm antibodies were confirmed by ELISA in either TLR9+/+ (n = 19) and TLR9−/− (n = 16) sera (D), or TLR3+/+ (n = 15) and TLR3−/− (n = 17) sera (E). Bars represent median values. *, P < 0.005 by Fisher's exact test (C) or the Mann-Whitney U test (D).
Figure 5.
Figure 5.
Lymphadenopathy, hypergammaglobulinemia, and lymphocyte accumulation in TLR-deficient mice. TLR9+/+ (n = 19), TLR9−/− (n = 16), TLR3+/+ (n = 15), and TLR3−/− (n = 17) mice were killed at 20 wk of age and assessed for evidence of aberrant immune activation; nonautoimmune C57BL/6 control mice (n = 4) were killed at 26 wk of age. (A) Spleens and the two largest axillary lymph nodes were removed and weighed. (B) Total serum IgG and IgG2a were determined. (C) Splenocyte subsets were enumerated by FACS analysis for T cells (Thy1.2+), DNTC (CD4/CD8 double-negative T cells), and B cells (CD22+). (D) Splenic CD4+ T cells were classified as either naive (CD44 CD62L+), activated (CD44+ CD62L+), or memory (CD44+ CD62L) phenotype. The analysis in D was performed on 12 TLR3+/+ and 12 TLR3−/− mice. Horizontal lines represent mean values.
Figure 6.
Figure 6.
Glomerulonephritis in the absence of anti-DNA autoantibodies. Histological renal disease was assessed in TLR9+/+ (n = 19), TLR9−/− (n = 16), TLR3+/+ (n = 15), and TLR3−/− (n = 17) mice at 20 wk of age. (A–F) Paraffin kidney sections from TLR9+/+ (A and B) and TLR9−/− (C and D) mice were stained with H&E (A and C) or PAS (B and D). Interstitial infiltrates (E) and glomerular disease (F) were scored from 0 to 4 for all mice. (G–L) Paraffin kidney sections from TLR3+/+ (G and H) and TLR3−/− (I and J) mice were stained with H&E (G and I) or PAS (H and J). Interstitial infiltrates (K) and glomerular disease (L) were scored from 0 to 4 for all mice. Representative images are shown. Original magnification: 100 for H&E sections (A, C, G, and I) and 400 for PAS sections (B, D, H, and J).
Figure 7.
Figure 7.
Glomerular immune deposits do not require anti-DNA antibodies. (A) Glomerular immune deposits were detected by direct immunofluorescence for IgG (top) and complement C3 (bottom) in frozen kidney sections from TLR9+/+ (left), TLR9−/− (middle), and nonautoimmune C57BL/6 control mice (right). Representative images are shown. Original magnification, 400. (B) Mean glomerular fluorescence intensity (arbitrary units) was determined for IgG and C3 in TLR9+/+ (n = 8) and TLR9−/− (n = 8) mice. Horizontal lines represent mean values.

References

    1. Notman, D.D., N. Kurata, and E.M. Tan. 1975. Profiles of antinuclear antibodies in systemic rheumatic diseases. Ann. Intern. Med. 83:464–469. - PubMed
    1. Kotzin, B. 1996. Systemic lupus erythematosus. Cell. 85:303–306. - PubMed
    1. Plotz, P.H. 2003. The autoantibody repertoire: searching for order. Nat. Rev. Immunol. 3:73–78. - PubMed
    1. Monestier, M., and B.L. Kotzin. 1992. Antibodies to histones in systemic lupus erythematosus and drug-induced lupus syndromes. Rheum. Dis. Clin. North Am. 18:415–436. - PubMed
    1. Hahn, B.H. 1998. Antibodies to DNA. N. Engl. J. Med. 338:1359–1368. - PubMed

Publication types

MeSH terms