Comparative Study
. 2005 Jul 26;102(30):10700-5.
doi: 10.1073/pnas.0501961102. Epub 2005 Jul 18.

Expansion of calcium microdomains regulates fast exocytosis at a ribbon synapse

Affiliations
Comparative Study

Expansion of calcium microdomains regulates fast exocytosis at a ribbon synapse

Vahri Beaumont et al. Proc Natl Acad Sci U S A. .

Abstract

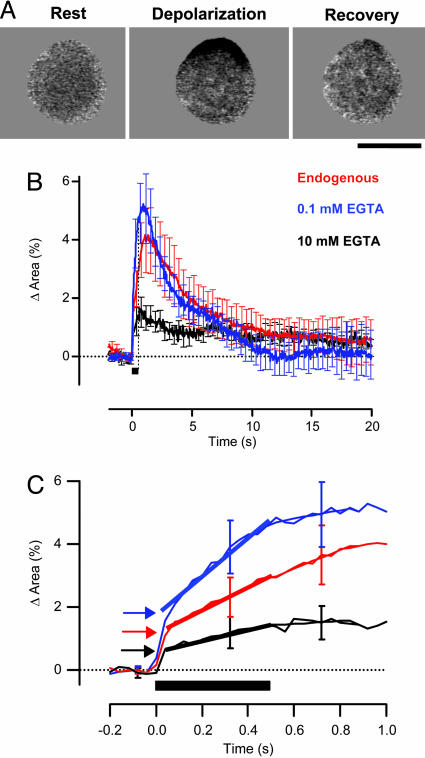
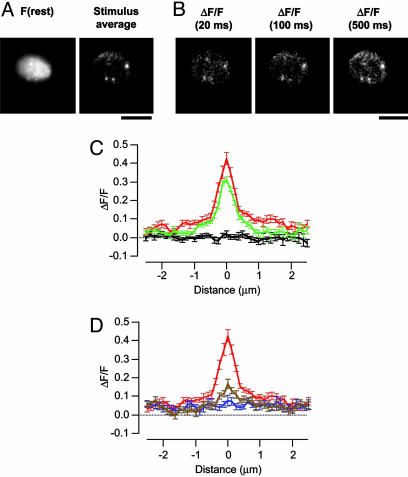
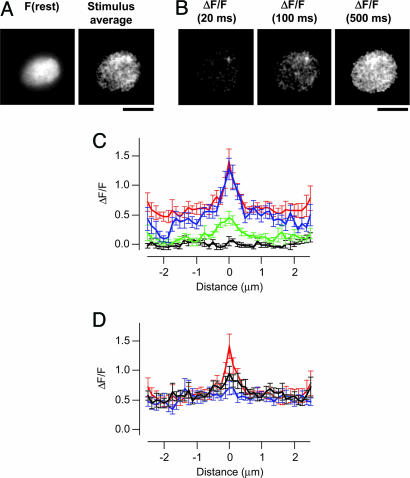
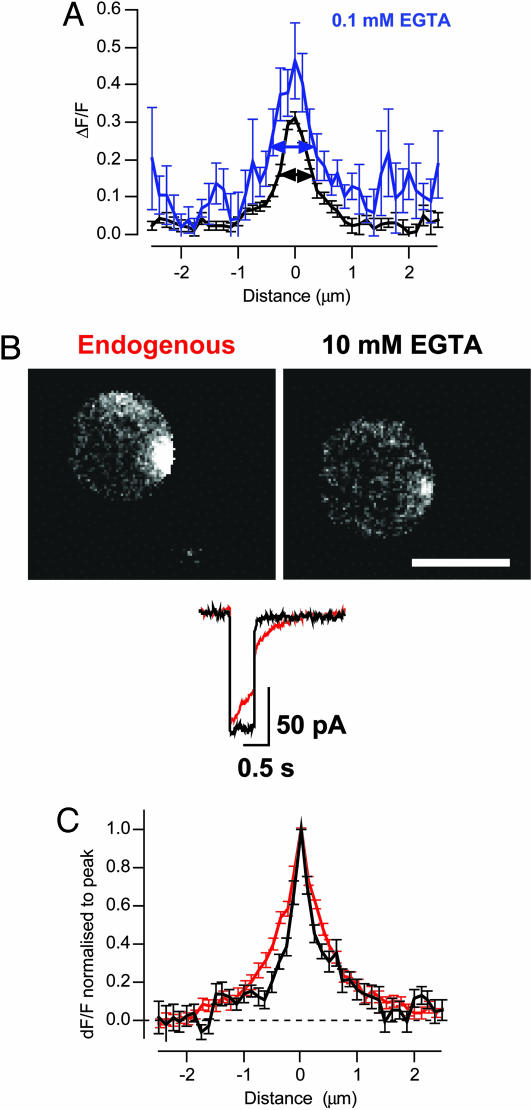
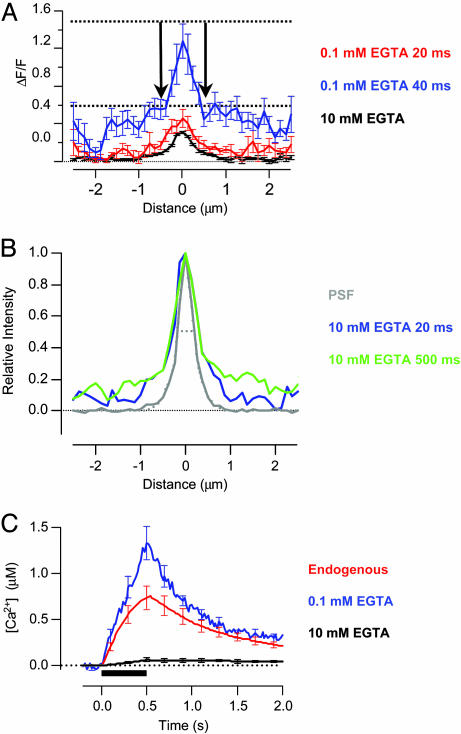
We investigated the Ca2+ signal regulating fast exocytosis at the ribbon synapse of retinal bipolar cells by using total internal reflection fluorescence microscopy to image fluorescent Ca2+ indicators and interference reflection microscopy to monitor exocytosis. Depolarization generated Ca2+ "microdomains" that expanded over the time scale during which the rapidly releasable pool (RRP) of vesicles was released (<40 ms). Replacing mobile Ca2+ buffers in the terminal with 10 mM EGTA prevented expansion of microdomains and decreased the number of rapidly releasable vesicles by a factor of 2. Conversely, decreasing the concentration of EGTA in the terminal to 0.1 mM increased the apparent width of a Ca2+ microdomain from 580 nm to 930 nm and increased the size of the RRP size by a factor of 1.5. The [Ca2+] over the area that the microdomain expanded was estimated to be 2-7 microM. These results indicate that vesicles within the RRP are located hundreds of nanometers from Ca2+ channels, and that fusion of these vesicles can be triggered by low micromolar levels of Ca2+. Variable distances between docked vesicles and Ca2+ channels at the active zone, therefore, provide an explanation for the heterogeneous release probability of vesicles comprising the RRP.


Figures

Fig. 1.
Fig. 1.
Exocytosis of the RRP and reserve pool of vesicles under different conditions of Ca2+ buffering. (A) Expansion of the footprint in response to a 500-ms depolarization imaged by IRM. The footprint is shown at rest, at the end of the stimulus period and 15 s after the stimulus. The dark area represents the region of increased destructive interference because of membrane expansion onto the coverslip (see also Movie 1 and Supporting Text for more detail on IRM). This recording was made in the perforated patch configuration. (Scale bar: 5 μm.) (B) Expansion of the footprint was measured by IRM under the following conditions of Ca2+ buffering: endogenous buffers (red trace, n = 12), 10 mM EGTA (black, n = 7), and 0.1 mM EGTA (blue, n = 8). The change in the area of the footprint is expressed as a percentage of the area at rest to allow a quantitative comparison with previous measurements made by using the capacitance technique and FM1-43. The timing of the depolarization is indicated by the black bar. (C) Expansion of the traces in B, to show the distinct kinetic phases of exocytosis. Release of the reserve pool of vesicles occurred at a relatively constant rate, which was measured by fitting traces with a straight line (shown by heavy lines). The size of the RRP was estimated by extrapolating this line back to the beginning of the stimulus (arrows). The rate of asynchronous release was estimated by fitting a straight line to the trace over the 300-ms period after the stimulus (thin lines). In the presence of endogenous buffers, release of the reserve pool was little affected by closure of Ca2+ channels.
Fig. 2.
Fig. 2.
Stationary microdomains in the presence of 10 mM EGTA. (A) Image of a footprint at rest, and ΔF/F averaged during a 500-ms depolarization. At least three distinct clusters of Ca2+ channels were observed, each colocalizing with a punctum of CG5N observed at rest. (Scale bar: 5 μm.) See also Movie 3. (B) Individual frames showing ΔF/F at the times indicated relative to the onset of the stimulus. (C) Averaged profile of ΔF/F, through Ca2+ microdomains at rest (black) and 20 ms (green) and 500 ms (red) after the onset of the stimulus. Average of 25 microdomains from ten footprints. (D) Profile through Ca2+ microdomains at the end of a 500 ms depolarization (red), and then 20 ms (brown) and 40 ms (blue) after closure of Ca2+ channels. Note that local Ca2+ gradients collapsed completely within 20 to 40 ms.
Fig. 3.
Fig. 3.
Evolving microdomains in the presence of 0.1 mM EGTA. (A) Image of a footprint at rest, and ΔF/F averaged during a 500-ms depolarization. One cluster of Ca2+ channels was observed. (Scale bar: 5 μm.) See also Movie 4. (B) Individual frames showing ΔF/F at the times indicated relative to the onset of the stimulus. (C) Averaged profile of ΔF/F through Ca2+ microdomains at rest (black) and 20 ms (green), 40 ms (blue), and 500 ms (red) after the onset of the stimulus. The spread of Ca2+ beyond the area of influx was obvious within 40 ms. After 500 ms of Ca2+ influx, the microdomain appeared to ride on top of a spatially uniform rise in Ca2+. Results are an average of 12 microdomains from 8 footprints. (D) Profile through Ca2+ microdomains at the end of a 500-ms depolarization (red), and then 20 ms (black) and 40 ms (blue) after closure of Ca2+ channels. Note that local Ca2+ gradients collapsed completely within 20 to 40 ms.
Fig. 4.
Fig. 4.
The spatial extent of Ca2+ microdomains related to the size of the RRP. (A) Comparison of the profile of ΔF/F, although Ca2+ microdomains imaged over the first 20 ms of Ca2+ influx in 0.1 mM (blue) and 10 mM EGTA (black). The width of the microdomain was measured as FWHM (arrowed lines). (B) Individual frames showing ΔF/F 20 ms after the onset of depolarization in the presence of endogenous Ca2+ buffers, and then after rupture of the patch to introduce 10 mM EGTA. These measurements were made by using Fluo-5F. (Scale bar: 5 μm.) The peak calcium current was not significantly altered after patch rupture. (C) Profile of ΔF/F through Ca2+ microdomains imaged over the first 20 ms of Ca2+ influx. FWHM was 770 ± 60 nm under endogenous buffer conditions (red) and 450 ± 50 nm after dialysis with 10 mM EGTA (black; 17 microdomains from 10 footprints).
Fig. 5.
Fig. 5.
Calcium signal governing fast and slow exocytosis. (A) Microdomain profiles measured by using CG5N at 20 ms (red) and 40 ms (blue) from the beginning of depolarization in 0.1 mM EGTA. The accumulation of Ca2+ beyond the source of influx was obvious at distances of a few hundred nanometers. The shallow gradient of Ca2+ around the periphery generated a maximum value of ΔF/F of ≈0.6 (lower dashed line). The stationary microdomain in 10 mM EGTA is also shown for comparison (black trace from B, after a 500-ms depolarization). Over the period that the RRP was released, the maximum value of ΔF/F in 0.1 mM EGTA did not exceed 1.5, placing an upper limit on the signal arising from spread of Ca2+ beyond this stationary microdomain. (B) Averaged intensity profile through a fluorescent bead 100 nm in diameter, providing a measure of the PSF of our microscope (gray). The dashed line fitted to the measurements is the sum of two Gaussians with standard deviations of 112 nm and 518 nm and relative amplitudes of 0.71:1. The PSF is also compared with the normalized profiles of the microdomains (CG5N) in 10 mM EGTA at 20 ms (blue) and 500 ms (green) from the beginning of depolarization. The profiles deviated from the PSF beyond a few hundred nanometers from the center, indicating a small accumulation of Ca2+ at these distances. (C) The increase in free [Ca2+] in response to a depolarization lasting 500 ms (bar) was measured in endogenous buffer conditions (red, using Fluo-5F), 10 mM EGTA (black, using Fluo-5F), and 0.1 mM EGTA (blue, using CG5N). Measurements were made in a region of interest covering 1.6 μm2 remote from microdomains.

References

    1. Katz, B. & Miledi, R. (1967) Nature 215, 651. - PubMed
    1. Miledi, R. (1973) Proc. R. Soc. London Ser. B 183, 421-425. - PubMed
    1. Augustine, G. J. (2001) Curr. Opin. Neurobiol. 11, 320-326. - PubMed
    1. Adler, E. M., Augustine, G. J., Duffy, S. N. & Charlton, M. P. (1991) J. Neurosci. 11, 1496-1507. - PMC - PubMed
    1. Augustine, G. J., Adler, E. M. & Charlton, M. P. (1991) Ann. N.Y. Acad. Sci. 635, 365-381. - PubMed

Publication types

LinkOut - more resources