. 2005 Jul 26;102(30):10421-6.
doi: 10.1073/pnas.0500298102. Epub 2005 Jul 18.

A tool for filtering information in complex systems

Affiliations

A tool for filtering information in complex systems

M Tumminello et al. Proc Natl Acad Sci U S A. .

Abstract

We introduce a technique to filter out complex data sets by extracting a subgraph of representative links. Such a filtering can be tuned up to any desired level by controlling the genus of the resulting graph. We show that this technique is especially suitable for correlation-based graphs, giving filtered graphs that preserve the hierarchical organization of the minimum spanning tree but containing a larger amount of information in their internal structure. In particular in the case of planar filtered graphs (genus equal to 0), triangular loops and four-element cliques are formed. The application of this filtering procedure to 100 stocks in the U.S. equity markets shows that such loops and cliques have important and significant relationships with the market structure and properties.


Figures
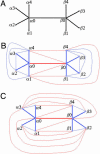
Fig. 1.
Fig. 1.
An illustrative example of two graphs that share the same MST but have distinct PMFGs. (A) MST of a simple system of 10 vertices. (B and C) PMFG of two systems with the same MST (the one drawn in A). The thicker lines are identifying links belonging to both the MST and the PMFG, whereas the thinner lines belong to the PMFG only.
Fig. 2.
Fig. 2.
PMFG obtained from the fully connected graph associated with the correlation coefficient matrix of the 100 most capitalized stocks traded in the U.S. equity markets during the time period from 1995 to 1998. Cross-correlation is computed by using daily returns of stocks. Stocks are indicated with their ticker symbols. For information about a specific ticker symbol, see Table 7, which is published as supporting information on the PNAS web site. The graph is topologically planar: It can be drawn on the plane without edge-crossings. The thicker lines belong to the associated MST. It should be noted that link lengths do not reflect the value of the similarity measure between vertices.
Fig. 3.
Fig. 3.
Analysis of stability of the MST and PMFG with respect to the statistical uncertainty present in the estimation of the correlation matrix as a function of the number of records of the multivariate time series. By assuming as reference matrix the empirical correlation matrix of the system, we perform 4 sets of 20 realizations, each one of surrogated multivariate time series. Each set is characterized by a different number of records set as follows: 1,000, 4,000, 16,000, and 64,000 records. For each of the simulated realizations, both the MST and PMFG have been constructed. The percent (1 - P) of the number of links of the simulated graphs nonmatching with the links of the MST and PMFG of real data are shown as a function of the number of records of the surrogated time series in a log–log plot. (The error bar indicates one standard deviation of 1 - P computed for each set.)

References

    1. Strogatz, S., H. (2001) Nature 410, 268-276. - PubMed
    1. Albert, R. & Barabási, A., L. (2002) Rev. Mod. Phys. 74, 47-97.
    1. Dorogovtsev, S. N. & Mendes, J. F. F. (2002) Adv. Phys. 51, 1079-1187.
    1. Newman, M., E., J. (2003) SIAM Rev. 45, 167-256.
    1. Garlaschelli, D., Caldarelli, G. & Pietronero, L. (2003) Nature 423, 165-168. - PubMed

LinkOut - more resources