

Validation and comparison of luminex multiplex cytokine analysis kits with ELISA: determinations of a panel of nine cytokines in clinical sample culture supernatants
- PMID: 16029895
- PMCID: PMC5738327
- DOI: 10.1016/j.jri.2005.03.005
Validation and comparison of luminex multiplex cytokine analysis kits with ELISA: determinations of a panel of nine cytokines in clinical sample culture supernatants
Abstract
Problem: Analyses of the expression pattern of multiple cytokines are frequently required for characterization of the status of the immune system as it pertains to Th type bias and intrinsic levels of inflammation. Classically, analysis of cytokine expression patterns has been performed by enzyme-linked immunosorbent assays (ELISA) for each separate analyte. A new technology, Luminex MAP, facilitates the simultaneous evaluation of multiple immune mediators with advantages of higher throughput, smaller sample volume, and lower cost. Validation of this technology has been limited to small sample sets, limited use of clinical study specimens, and use of non-commercial reagents.
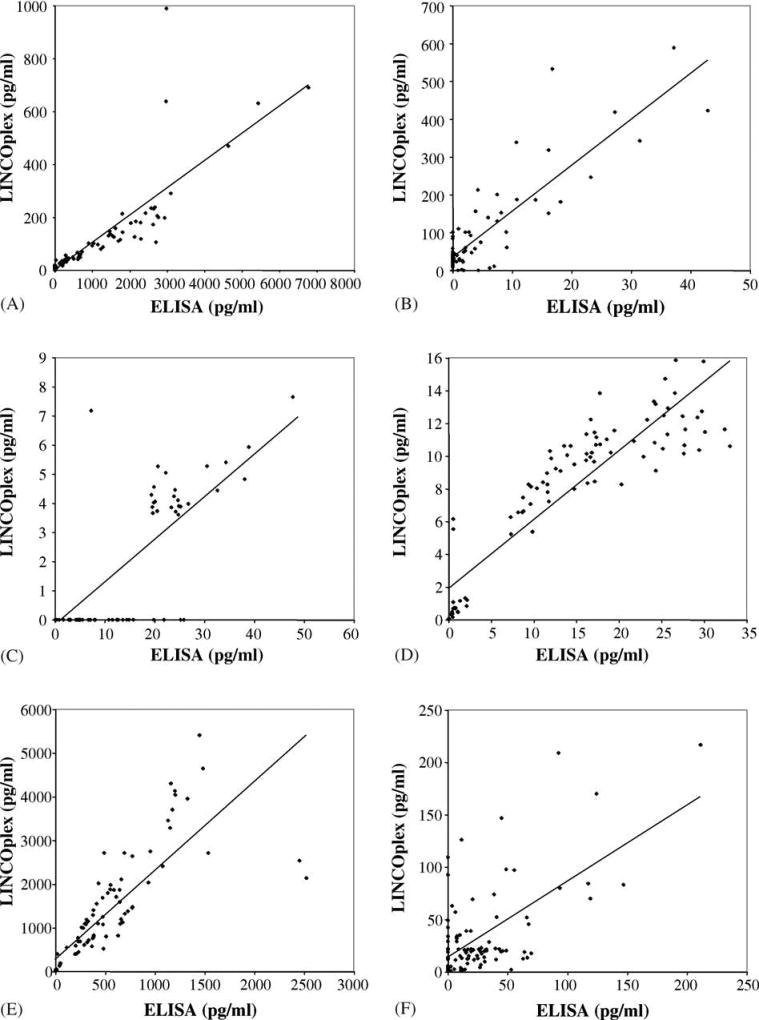
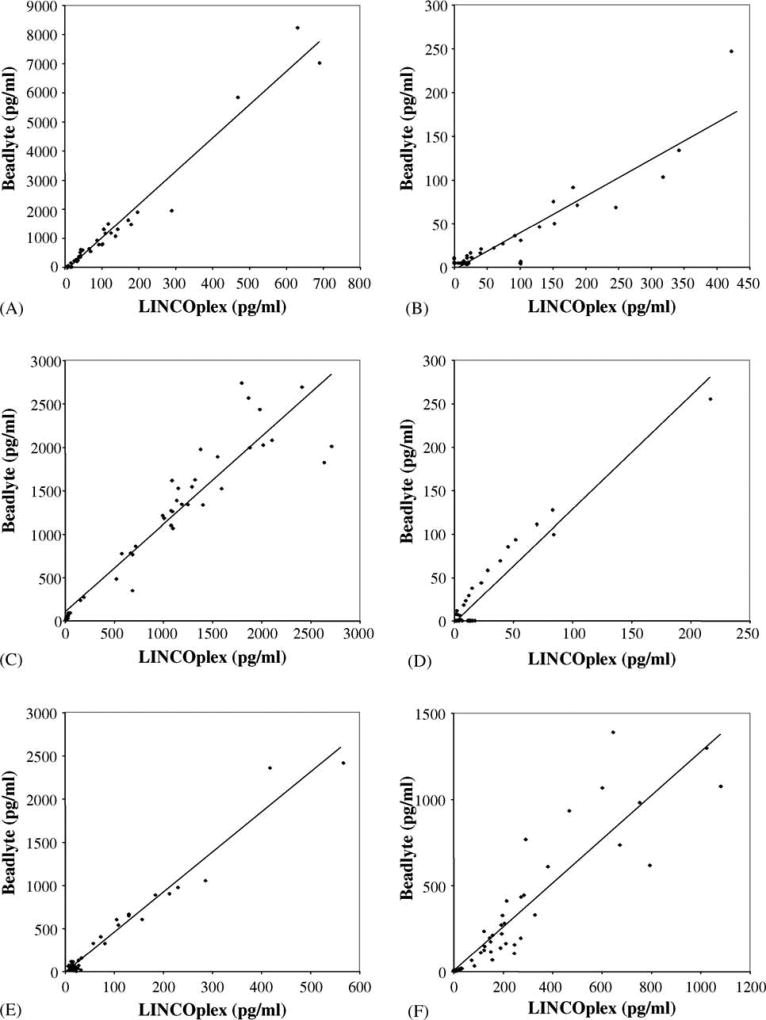
Methods: Ninety-six specimens from women over the course of their respective pregnancies were evaluated for cytokine concentrations using commercially available ELISA kits and commercially available Luminex MAP kits according to the manufacturers' directions. Correlations between data sets were evaluated using Pearson's correlation coefficient (r).
Results: Excellent correlations were demonstrated for IL-1 beta, IL-4, IL-5, IL-6, IL-10, IFN gamma, and TNF alpha, in contrast to IL-12 p 70 and IL-13.
Conclusions: Luminex multiplex technology has distinct advantages and is a valid alternative method to ELISA for the evaluation of the majority of cytokines tested and for the characterization of immune system status.
Figures


References
-
- Ader R, Felten DL, Cohen N, editors. Psychoneuroimmunology. Academic Press; San Diego, CA: 2001.
-
- Balkanli-Kaplan P, Gucer F, Ali Yuce M. Eur. J. Obstet. Gynecol. Reprod. Biol. 2004;114:239–240. (author reply 241) - PubMed
-
- Bamford RN, Battiata AP, Waldmann TA. J. Leukoc. Biol. 1996;59:476–480. - PubMed
-
- Becher B, Prat A, Antel JP. Glia. 2000;29:293–304. - PubMed
-
- Besedovsky HO, del Rey A. Z. Rheumatol. 2000;59(Suppl. 2):26–30. - PubMed
Publication types
MeSH terms
Substances
Grants and funding
LinkOut - more resources
Full Text Sources
Other Literature Sources
Medical
