. 2005 Nov 1;106(9):3142-9.
doi: 10.1182/blood-2004-10-4057. Epub 2005 Jul 19.

Overexpression of Shp2 tyrosine phosphatase is implicated in leukemogenesis in adult human leukemia

Affiliations

Overexpression of Shp2 tyrosine phosphatase is implicated in leukemogenesis in adult human leukemia

Rongzhen Xu et al. Blood. .

Abstract

Shp2 tyrosine phosphatase plays a critical role in hematopoiesis, and dominant active mutations have been detected in the human gene PTPN11, encoding Shp2, in child leukemia patients. We report here that although no such mutations were detected in 44 adult leukemia patients screened, Shp2 expression levels were significantly elevated in primary leukemia cells and leukemia cell lines, as compared with normal hematopoietic progenitor cells. The Shp2 protein amounts correlated well with the hyperproliferative capacity but were inversely associated with the differentiation degree of leukemia cells. Suppression of Shp2 expression induced apoptosis and inhibition of leukemic cell clonogenic growth. Notably, the majority of Shp2 was preferentially localized to the plasma membrane and was constitutively phosphorylated on tyrosine in leukemia cells, and also in normal hematopoietic cells following mitogenic stimulation. Based on these results, we propose that aberrantly increased expression of Shp2 may contribute, collaboratively with other factors, to leukemogenesis.


Figures

Figure 1.
Figure 1.
Altered expression, subcellular localization, tyrosine phosphorylation of Shp2 in human leukemia cell lines. (A) Cell lysates (20 μg total proteins) were analyzed by Western blot with antibodies against Shp2 or β-actin, as a control for equal sample loading. (B) For normal hematopoietic cell samples (PBMNCs), 30 μg total proteins were loaded for Western blot analysis for Shp2 and β-actin, while 5 μg total proteins from NB4 leukemia cell lysate was used as a positive control for the 2 Shp2 bands and for comparison of the relative Shp2 contents. (C) The histogram shows p-Shp2 protein levels normalized against the actin expression in leukemia cell lines and normal PBMNC samples. Data are representative of 3 independent experiments. (D) Leukemic cells were lysed in hypotonic buffer, and lysates were used to prepare total cellular protein (T), cytosolic (C), membrane-soluble (M), and nucleus (N) fractions as described in the text. An aliquot of each fraction (20 μg total proteins) was subjected to immunoblot analysis for Shp2. (E) Proteins were immunoprecipitated from each fraction with an anti-Shp2 antibody and subjected to immunoblot analysis with an antiphosphotyrosine (pTyr) antibody. IP indicates immunoprecipitation. Data are representative of 2 independent experiments.
Figure 2.
Figure 2.
Increased Shp2 expression in primary leukemia cells. (A) A representative Western blot result of partial leukemia cases. (B) Statistical analysis of all cases tested. For each sample, 20 μg cellular proteins was analyzed by Western blot for Shp2 and β-actin. Results were expressed as the ratios of Shp2 to β-actin, and the mean value in each group was indicated. (C) Total RNA was isolated from fresh leukemia cell samples from patients at diagnosis, and analyzed by RT-PCR using Shp2-specific primers described in the text. β-actin cDNA primers were used as internal control. PCR products were electrophoresed on 1% agarose gel stained with ethidium bromide. (D) Results were expressed as the ratios of Shp2 to β-actin. Horizontal lines in panels B and D represent means.
Figure 3.
Figure 3.
Mitogenic stimulation of Shp2 phosphorylation and relocation. Normal resting hematopoietic cells were stimulated with PHA and collected at different time points for analysis of Shp2 protein levels by Western blotting. The histogram shows p-Shp2 (formula image) versus Shp2 (□) contents in samples enriched with resting or proliferating hematopoietic cells. Data are representative of 3 independent experiments.
Figure 4.
Figure 4.
Subcellular localization of Shp2 in leukemia cells during cell cycle. (A) Cells at interphase. (B) Cells at mitosis. Double immunofluorescence labeling of Shp2 with Ki-67 antigen was performed in quiescent and proliferating cells. Cells were fixed, permeabilized, and stained with anti-Shp2 (green) and anti–Ki-67 antigen (red) antibodies. The scale bar represents 10 μm. Similar results were also found in lymphoblastic leukemic cells and normal hematopoietic progenitor cells (data not shown). Images were viewed at 400 ×/0.75 numerical aperture (NA), with a Zeiss Axioskop II microscope, Images were captured with a SPOT 1.3.0 CCD camera (Diagnostic Instruments, Detroit, MI) and transferred to Adobe Photoshop 6.0 (Adobe, San Jose, CA).
Figure 5.
Figure 5.
Relationship between p-Shp2 levels and bone marrow cellularity in leukemia. For each sample, 20 μg cellular proteins was analyzed by Western blot with anti-Shp2 and β-actin antibodies. Results were expressed as Shp2/β-actin ratios, and the mean values in hypercellular leukemia and nonhypercellular leukemia cases were 1.873 ± 0.527 and 0.525 ± 0.262, respectively.
Figure 6.
Figure 6.
Shp2 expression inversely correlates with differentiation of hematopoietic cells. (A) Leukemic cells were treated with ATRA at 1 μM and collected at different time points to determine the percentage of cells in the S phase (top panel) and the Shp2 protein amounts by Western blot (bottom panel). (B) CD11b expression levels by FCM analysis. (C) In top panel, leukemic cells were treated with ATRA at 1 μM, and collected at 72 hours for analysis of Shp2 expression using double immunofluorescence labeling with anti-Shp2 (green) and Ki-67 (red) antibodies. Shown are leukemia cells before and after induction with ATRA. For morphologic analysis, cells untreated or treated with ATRA for 72 hours were collected and stained with Wright-Giemsa staining. The bottom panel shows NB4 cells treated with Shp2 AS (2 μM) for 0 and 72 hours. Images were viewed at 100 ×/0.3 NA with a Zeiss Axiovert S100 microscope. Images were captured with a SPOT 1.3.0 CCD camera and transferred to Adobe Photoshop 6.0. (D) NB4 cells were treated with Shp2 AS at 3 μM and collected at different time points for analysis of cell cycles with FCM. Error bars represent standard error. (E) CD11b expression levels on NB4 cells were determined by FCM analysis following treatment with Shp2 AS (2 μM) for 72 hours. The scale bar represents 10 μm. Data are representative of 3 independent experiments.
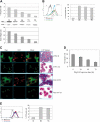
Figure 7.
Figure 7.
Shp2 antisense oligonucleotides induce growth inhibition and apoptosis of leukemic clonogenic growth. (A) Leukemic cells were plated in 24-well culture plates in 0.5% soft agar with different concentrations of Shp2-specific antisense oligonucleotide (▪) for 7 days, and then colonies (> 40 cells) were counted using an inverted microscope. Each experiment was performed at least 3 times. Note: The sense oligonucleotide of Shp2 (□) was also found to have a modest growth inhibition on leukemic colonies at high concentrations. (B) Microphotographs of leukemic colonies after exposure to antisense (i, iii) and sense (ii, iv) oligonucleotides at 2 μM for 72 hours. Images were viewed at 400 ×/0.75 NA, with a Zeiss Axioskop II microscope. Images were captured with a SPOT 1.3.0 CCD camera and transferred to Adobe Photoshop 6.0. (C) Leukemia cells were cultured in RPMI-1640 with 10% serum, treated with different doses (0 μM-4 μM) of Shp2-specific antisense oligonucleotides for 72 hours, and then collected for analysis of Shp2 expression by Western blot, and apoptosis with FCM. Data are representative of 3 independent experiments with standard error.

References

    1. Qu CK, Shi ZQ, Shen R, Tsai FY, Orkin SH, Feng GS. A deletion mutation in the SH2-N domain of Shp-2 severely suppresses hematopoietic cell development. Mol Cell Biol. 1997;17: 5499-5507. - PMC - PubMed
    1. Qu CK, Yu WM, Azzarelli B, Cooper S, Broxmeyer HE, Feng GS. Biased suppression of hematopoiesis and multiple developmental defects in chimeric mice containing Shp-2 mutant cells. Mol Cell Biol. 1998;18: 6075-6082. - PMC - PubMed
    1. Chan RJ, Johnson SA, Li Y, Yoder MC, Feng GS. A definitive role of Shp-2 tyrosine phosphatase in mediating embryonic stem cell differentiation and hematopoiesis. Blood. 2003;102: 2074-2080. - PubMed
    1. Qu CK, Nguyen S, Chen J, Feng GS. Requirement of Shp-2 tyrosine phosphatase in lymphoid and hematopoietic cell development. Blood. 2001;97: 911-914. - PubMed
    1. Boulton TG, Stahl N, Yancopoulos GD. Ciliary neurotrophic factor/leukemia inhibitory factor/interleukin 6/oncostatin M family of cytokines induces tyrosine phosphorylation of a common set of proteins overlapping those induced by other cytokines and growth factors. J Biol Chem. 1994;269: 11648-11655. - PubMed

Publication types

MeSH terms

Substances