. 2005 Aug;187(15):5166-78.
doi: 10.1128/JB.187.15.5166-5178.2005.

Bacillus subtilis phosphorylated PhoP: direct activation of the E(sigma)A- and repression of the E(sigma)E-responsive phoB-PS+V promoters during pho response

Affiliations

Bacillus subtilis phosphorylated PhoP: direct activation of the E(sigma)A- and repression of the E(sigma)E-responsive phoB-PS+V promoters during pho response

Wael R Abdel-Fattah et al. J Bacteriol. 2005 Aug.

Abstract

The phoB gene of Bacillus subtilis encodes an alkaline phosphatase (PhoB, formerly alkaline phosphatase III) that is expressed from separate promoters during phosphate deprivation in a PhoP-PhoR-dependent manner and at stage two of sporulation under phosphate-sufficient conditions independent of PhoP-PhoR. Isogenic strains containing either the complete phoB promoter or individual phoB promoter fusions were used to assess expression from each promoter under both induction conditions. The phoB promoter responsible for expression during sporulation, phoB-P(S), was expressed in a wild-type strain during phosphate deprivation, but induction occurred >3 h later than induction of Pho regulon genes and the levels were approximately 50-fold lower than that observed for the PhoPR-dependent promoter, phoB-P(V). E(sigma)E was necessary and sufficient for P(S) expression in vitro. P(S) expression in a phoPR mutant strain was delayed 2 to 3 h compared to the expression in a wild-type strain, suggesting that expression or activation of sigma(E) is delayed in a phoPR mutant under phosphate-deficient conditions, an observation consistent with a role for PhoPR in spore development under these conditions. Phosphorylated PhoP (PhoP approximately P) repressed P(S) in vitro via direct binding to the promoter, the first example of an E(sigma)E-responsive promoter that is repressed by PhoP approximately P. Whereas either PhoP or PhoP approximately P in the presence of E(sigma)A was sufficient to stimulate transcription from the phoB-P(V) promoter in vitro, roughly 10- and 17-fold-higher concentrations of PhoP than of PhoP approximately P were required for P(V) promoter activation and maximal promoter activity, respectively. The promoter for a second gene in the Pho regulon, ykoL, was also activated by elevated concentrations of unphosphorylated PhoP in vitro. However, because no Pho regulon gene expression was observed in vivo during P(i)-replete growth and PhoP concentrations increased only threefold in vivo during phoPR autoinduction, a role for unphosphorylated PhoP in Pho regulon activation in vivo is not likely.


Figures
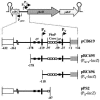
FIG. 1.
FIG. 1.
Chromosomal organization of the phoB-ydhF operon and its promoter deletions. Genes are represented by arrows that indicate the direction of transcription. The original DNA clone containing the ydhG-phoB intergenic region was fused with a promoterless lacZ gene in pDH32, resulting in plasmid pCB619. The physical locations of the phoB-PV and phoB-PS transcription start sites (arrows), the putative σA and σE consensus −10 and −35 recognition sequences (solid boxes), and the PhoP core binding region (open boxes) are indicated. The line separation was used to reduce the physical distance between bases −178 and −361 (the putative location of the ydhG promoter) relative to the phoB translational start site at position 1. For promoter deletion analysis various DNA fragments containing the PS and/or PV transcription start sites were fused with a promoterless lacZ gene in pDH32, resulting in plasmids pRC695, pRC696, and pPS2, as indicated.
FIG. 2.
FIG. 2.
Expression of phoB promoter-lacZ reporters from different phoB promoter deletions in wild-type, phoPR, and sigE mutant B. subtilis strains during 12 h of growth in LPDM and SSG medium. Plasmids pRC695, pRC696, and pPS2 containing the lacZ reporter fused to the PS+V (circles), PV (squares), and PS (triangles) promoters, respectively, were linearized and used to transform wild-type (WT) (JH642), phoPR (MH5913), and sigE (EU8701) parental strains. The resulting isogenic strains (Table 1) were grown under phosphate-limiting conditions in LPDM (A, B, and C) or SSG medium (D, E, and F). Growth (solid symbols) and β-galactosidase specific activity (open symbols) were determined at the times indicated. Time zero was the transition from the exponential to the stationary phase of growth. The outer right ordinate in panel A corresponds to the high expression level from the PS+V (circles) and PV (squares) promoter derivatives, while the inner right ordinate corresponds to expression from the PS promoter derivatives (triangles).
FIG. 3.
FIG. 3.
Expression of phoB-PS lacZ in wild-type and phoPR mutant B. subtilis strains during 24 h of growth in LPDM. Expression of PS-lacZ was determined in wild-type strain MH6143 (squares) and phoPR MH6146 (triangles) grown under phosphate-limiting conditions in LPDM. Solid symbols, growth; open symbols, β-galactosidase specific activity. Time zero was the transition from the exponential to the stationary phase of growth.
FIG. 4.
FIG. 4.
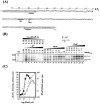
In vitro transcription analysis of the phoB promoter. (A) Nucleotide sequence of the phoB promoter coding strand. Regulatory elements are indicated as follows: arrows, transcription start sites for PS and PV; subscripts, −10 sequences for both promoters and −35 sequence for the PS promoter; superscripts, consensus PhoP tandem binding sequences; SD, Shine-Dalgarno sequence; Met, methionine (translational start codon). The lowercase letters indicate mismatches with the consensus sequence. The thick line and the dashed line indicate the DNase I-protected regions for PhoP(∼P) on the coding and noncoding strands, respectively, and the arrowheads indicate the previously identified hypersensitive sites in the footprints. Primers FMH746 and FMH745, used to amplify the phoB promoter, are indicated by arrows (5′ to 3′ direction) for the coding and noncoding strands, respectively. The numbers below the sequences indicate positions relative to the phoB translational start site (position 1). The numbers above the sequences indicate positions relative to the transcription start site of the PS or PV promoter. (B) In vitro transcription analysis of phoB promoter using various concentrations of the core (E) and sigma factor (σ) (lanes 1 through 8) in the reconstituted RNAP. (Upper panel) EσE; (lower panel) EσA. Linearly increasing concentrations of unphosphorylated PhoP (in twofold increments) were used in both the EσE- and EσA-driven transcription reactions in the absence of *PhoR (lanes 9 through 16) or in the presence of *PhoR at a final concentration of 0.18 μM (lanes 17 through 24). The protein concentrations (μM) are indicated above the lanes. Lane M contained a radiolabeled RNA marker. nts, nucleotides.
FIG. 5.
FIG. 5.
Effect of deleting the downstream direct repeats on PhoP∼P-mediated repression of transcription from the σE-dependent phoB-PS promoter in vitro. (A) The upper panel shows in vitro transcription of the phoB-PS promoter lacking the downstream direct repeats, using EσE alone (lane 1) and various concentrations of PhoP∼P (lanes 2 through 6) or unphosphorylated PhoP (2.8 μM) (lane 7). The histogram in the lower panel shows the relative amounts of phoB-PS transcripts in vitro (in PhosphorImager output units) obtained using the PS+V promoter with unphosphorylated PhoP (open bars) or PhoP∼P (solid bars) and using the PS promoter with PhoP∼P (shaded bars). For comparison, the maximum transcript output obtained from the PS+V or PS promoter with EσE alone was normalized to 100%. (B) Specificity of the PhoP∼P-mediated repression of transcription from the phoB-PS promoter. The phoB-PS promoter and the spoIIID promoter (a PhoP∼P-insensitive, σE-dependent promoter) were used as templates for in vitro transcription reactions using EσE alone (lane 1), EσE with unphosphorylated PhoP (lane 2), and EσE with PhoP in the presence of a low *PhoR concentration (0.18 μM) (lane 3) or a high *PhoR concentration (0.35 μM) (lane 4). (C) PhoP∼P binds to the phoB-PS promoter independent of the downstream direct repeats. Gel mobility shift assays were performed using a 325-bp 32P-labeled phoB-PS+V or 500-bp 32P-labeled phoB-PS promoter fragment in the absence of PhoP∼P (lane 1) or in presence of various PhoP∼P concentrations (lanes 2 through 8). The positions of the free DNA probe (Fp) and shifted PhoP∼P-DNA complex (CPhoP∼P) are indicated on the right. The protein concentrations (μM) are indicated above the lanes. nts, nucleotides.
FIG. 6.
FIG. 6.
Effects of various concentrations of unphosphorylated PhoP, PhoP∼P, and σA on transcription activation from the phoB-PV promoter in vitro. (A) The upper panels show the results of an in vitro transcription analysis of the phoB promoter using reconstituted EσA in the presence of various concentrations of unphosphorylated PhoP (Un) or phosphorylated PhoP (∼P). The graph in the lower panel shows the amounts of the phoB-PV transcripts (in PhosphorImager output units) plotted as a function of the unphosphorylated PhoP (open circles) or PhoP∼P (solid circles) concentration. The PhoP-to-PhoR molar ratios (plus signs) are plotted as a function of the various PhoP concentrations used in the in vitro transcription reactions. (B) Dependence of unphosphorylated PhoP-driven transcription reactions on σA concentration: in vitro transcription of the phoB promoter using various concentrations of σA in reconstituted RNAP in the presence of the optimum concentration of either unphosphorylated PhoP (Un*) (2.8 μM) or PhoP∼P (∼P*) (0.18 μM). The protein concentrations (μM) are indicated above the lanes.
FIG. 7.
FIG. 7.
In vitro transcription analysis of a second PhoP-regulated promoter, ykoL. (A) Nucleotide sequence of the ykoL promoter coding strand. Regulatory elements are indicated as follows: arrows, transcription start site for PV; subscripts, −10 sequences for PV promoter; superscripts, consensus PhoP tandem binding sequences; SD, Shine-Dalgarno sequence; Met, methionine (translational start codon). The lowercase letters indicate mismatches with the consensus sequence. Primers FMH768 and FMH769 used to prepare the ykoL promoter are indicated by arrows under the coding and noncoding strands, respectively. The numbers below the sequences indicate the positions relative to the ykoL translational start site (position 1). The numbers above the sequences indicate the positions relative the transcription start sites of PV. (B) Runoff in vitro transcription analysis of ykoL promoter using various concentrations of purified B. subtilis sigma factor (σA) and core RNAP (E) (lanes 1 through 8). Linearly increasing concentrations of unphosphorylated PhoP (in twofold increments) were used in the EσA-driven transcription reactions in the absence of *PhoR (lanes 9 through 16) or in the presence of *PhoR at a final concentration of 0.18 μM (lanes 17 to 23). The protein concentrations (μM) are indicated above the lanes. Lane M contained a radiolabeled RNA marker. (C) Amount of ykoL-PV transcript (in PhosphorImager output units) plotted as a function of the unphosphorylated PhoP concentration (open circles) or the PhoP∼P concentration (solid circles). nts, nucleotides.
FIG. 8.
FIG. 8.
Western immunoblot detection of cellular PhoP levels during the phosphate starvation response. (A) Dilutions of purified standard PhoP were prepared in phoPR cell lysates and used for Western immunoblot detection using PhoP-specific antibody (left panel). The standard curve in the graph on the right was prepared as described in Materials and Methods. (B) For Western immunoblot detection of intracellular PhoP concentrations, the wild-type strain (MH6143) was allowed to grow in LPDM, and samples were collected at the times indicated. Enzymatic cell lysis was performed as described in Materials and Methods. Microscopic cell counting was performed, and samples were calibrated in phoPR cell lysates to a final concentration equivalent to 2 × 10⁷ cells/μl. From the calibrated samples, 4 μl (equivalent to lysate from 8 × 10⁷ cells) and 10 μl (equivalent to lysate from 2 × 10⁸ cells) were electrophoresed on 12% SDS-polyacrylamide gel electrophoresis gels and subjected to immunoblot detection using PhoPCTD-specific antibody. Growth (OD540), microscopic cell counts, APase specific activities, and extracellular inorganic phosphate concentrations were determined at the times indicated. Time zero was the transition from the exponential to the stationary phase of growth.

Similar articles

Cited by

References

    1. Ames, B. N., and D. T. Dubin. 1960. The role of polyamines in the neutralization of bacteriophage deoxyribonucleic acid. J. Biol. Chem. 235:769-775. - PubMed
    1. Antelmann, H., C. Scharf, and M. Hecker. 2000. Phosphate starvation-inducible proteins of Bacillus subtilis: proteomics approach and transcriptional analysis. J. Bacteriol. 182:4478-4490. - PMC - PubMed
    1. Birck, C., Y. Chen, F. M. Hulett, and J.-P. Samama. 2003. The crystal structure of the phosphorylation domain in PhoP reveals a functional tandem association mediated by an asymmetric interface. J. Bacteriol. 185:254-261. - PMC - PubMed
    1. Birkey, S. M., W. Liu, X. Zhang, M. F. Duggan, and F. M. Hulett. 1998. Pho signal transduction network reveals direct transcriptional regulation of one two-component system by another two-component regulator: Bacillus subtilis PhoP directly regulates production of ResD. Mol. Microbiol. 30:943-953. - PubMed
    1. Birkey, S. M., G. Sun, P. J. Piggot, and F. M. Hulett. 1994. A pho regulon promoter induced under sporulation conditions. Gene 147:95-100. - PubMed

Publication types

MeSH terms

LinkOut - more resources