

Methodological issues in measuring health disparities
- PMID: 16032956
- PMCID: PMC3681823
Methodological issues in measuring health disparities
Abstract
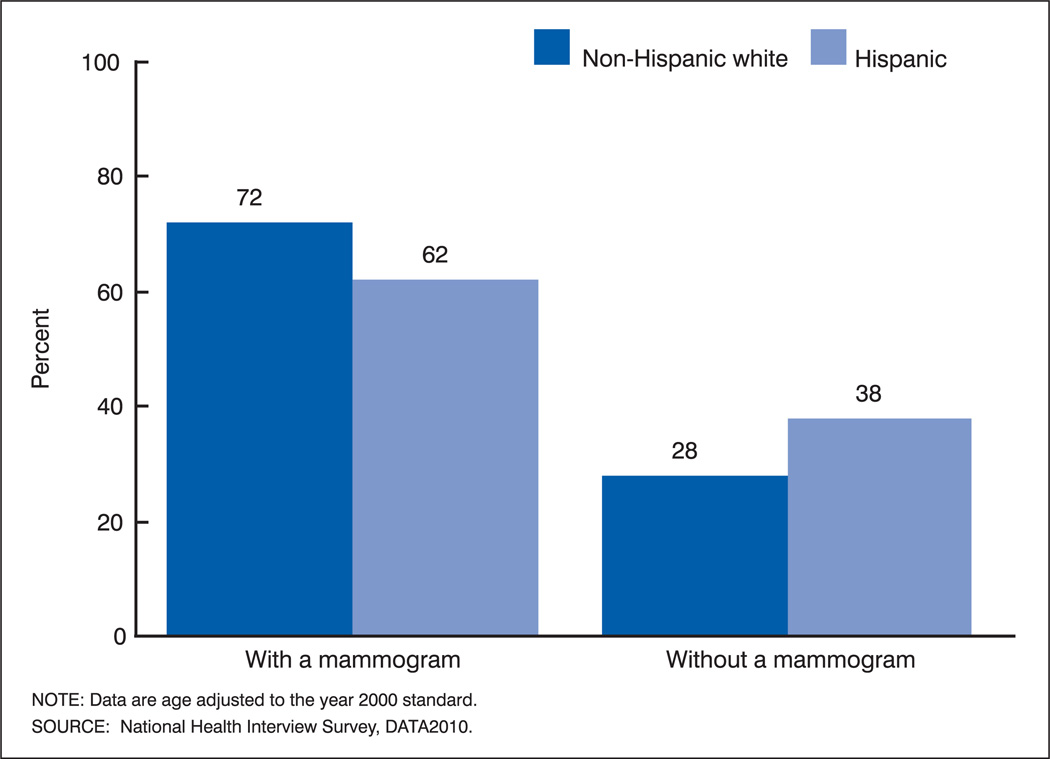
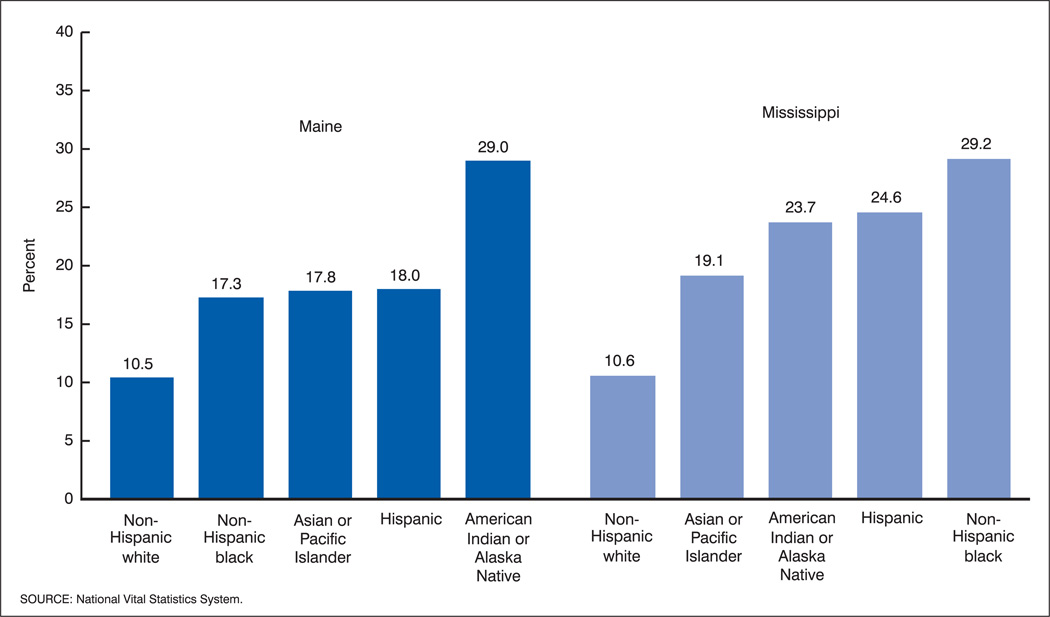
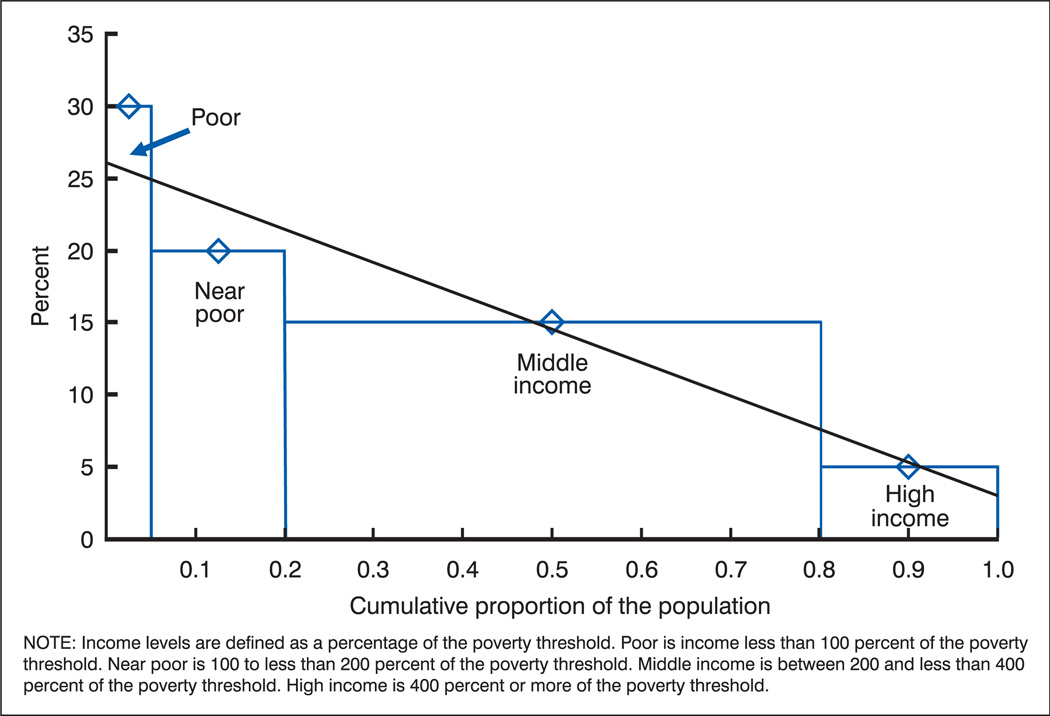
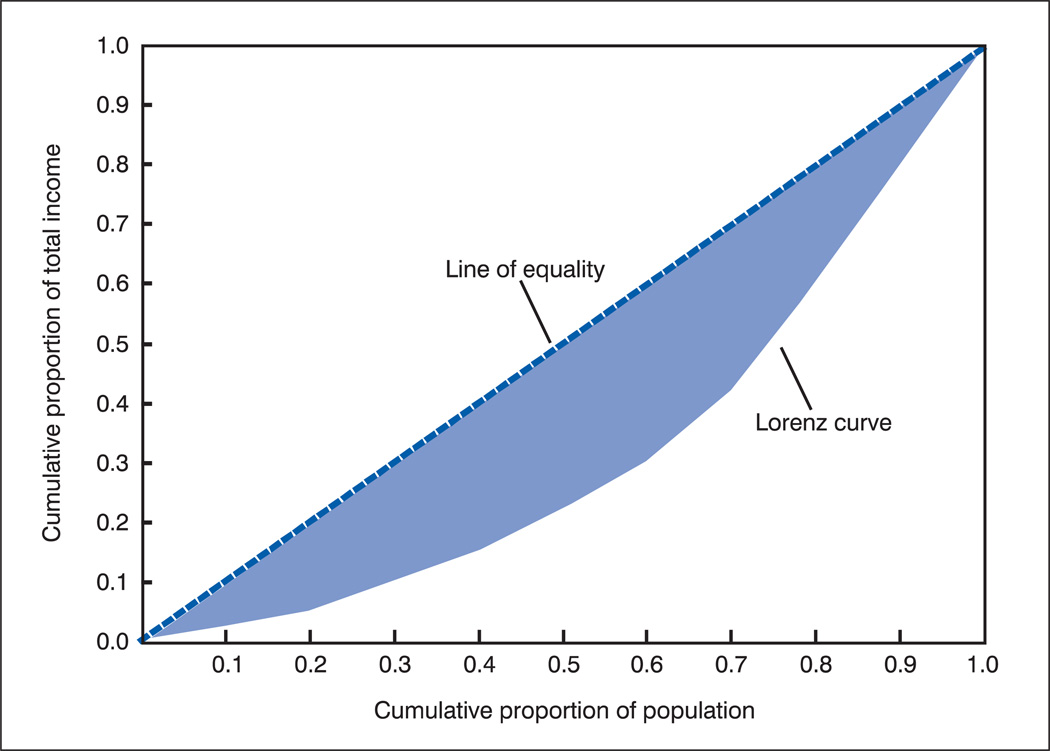
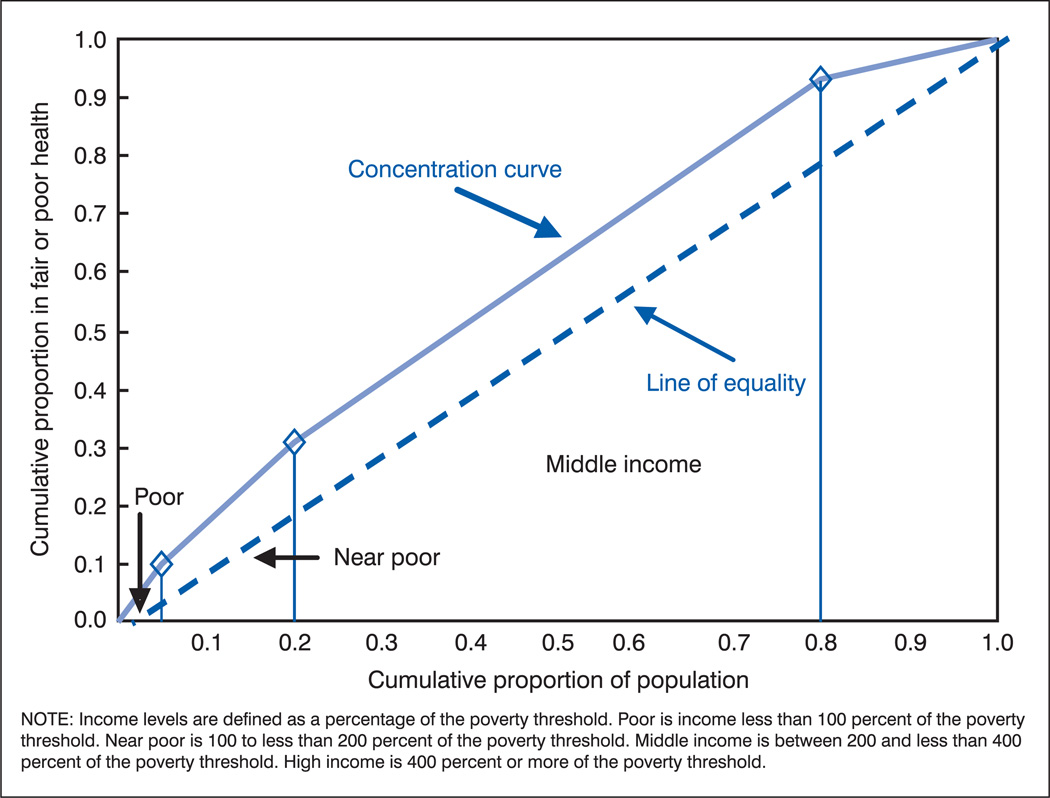
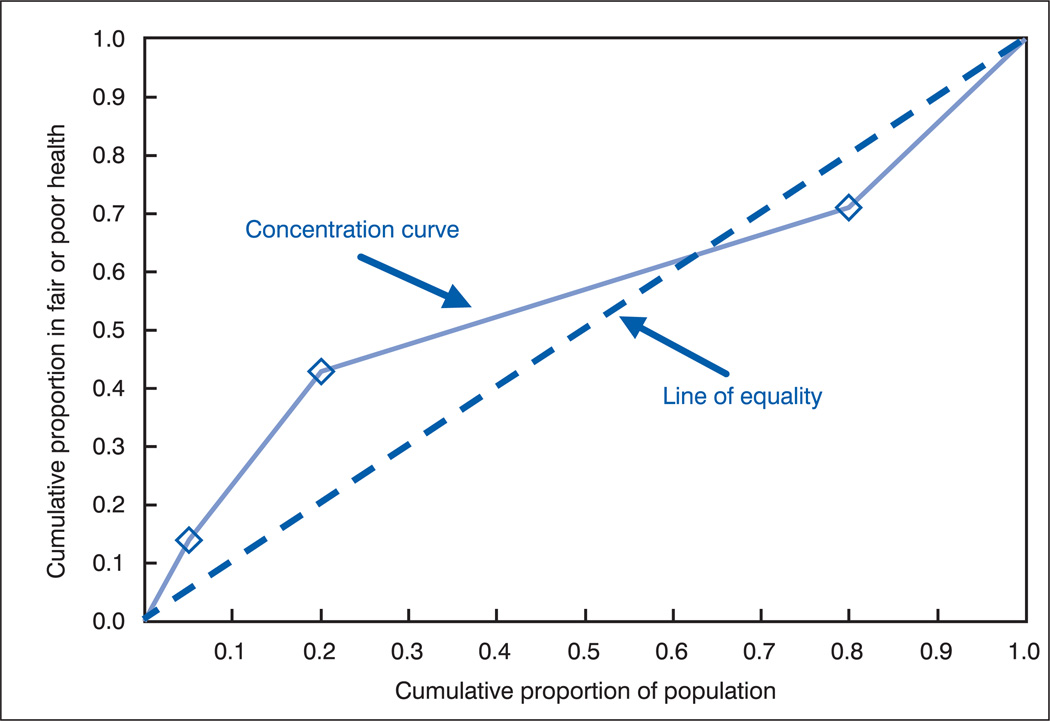
Objectives: This report discusses six issues that affect the measurement of disparities in health between groups in a population: Selecting a reference point from which to measure disparity. Measuring disparity in absolute or in relative terms. Measuring in terms of favorable or adverse events. Measuring in pair-wise or in summary fashion. Choosing whether to weight groups according to group size. Deciding whether to consider any inherent ordering of the groups. These issues represent choices that are made when disparities are measured.
Methods: Examples are used to highlight how these choices affect specific measures of disparity.
Results: These choices can affect the size and direction of disparities measured at a point in time and conclusions about the size and direction of changes in disparity over time. Eleven guidelines for measuring disparities are presented.
Conclusions: Choices concerning the measurement of disparity should be made deliberately, recognizing that each choice will affect the results. When results are presented, the choices on which the measurements are based should be described clearly and justified appropriately.
Figures
References
-
- U. S. Department of Health and Human Services. With understanding and improving health and objectives for improving health. 2nd ed. 2 vols. Washington: U. S. Government Printing Office; 2000. Healthy People 2010.
-
- U. S. Department of Health and Human Services strategic plan. Washington: U. S. Department of Health and Human Services; http://aspe.hhs.gov/hhsplan/
-
- U. S. Department of Health and Human Services. National healthcare disparities report. Rockville, MD: Agency for Healthcare Research and Quality; 2004. http://www.qualitytools.ahrq.gov/disparities report/browse/browse.aspx.
-
- Racial and ethnic health disparities in North Carolina, report card 2003. Office of Minority Health and Health Disparities and State Center for Health Statistics. North Carolina Department of Health and Human Services. 2003
-
- Anand S, Diderichsen F, Evans T, et al. Measuring disparities in health: Methods and indicators. In: Evans T, Whitehead M, Diderichsen F, et al., editors. Challenging inequalities in health: From ethics to action. Oxford: Oxford University Press; 2001.
MeSH terms
Grants and funding
LinkOut - more resources
Full Text Sources
