. 2005 Jul 20;25(29):6734-44.
doi: 10.1523/JNEUROSCI.1510-05.2005.

Modulator effects of interleukin-1beta and tumor necrosis factor-alpha on AMPA-induced excitotoxicity in mouse organotypic hippocampal slice cultures

Affiliations

Modulator effects of interleukin-1beta and tumor necrosis factor-alpha on AMPA-induced excitotoxicity in mouse organotypic hippocampal slice cultures

Liliana Bernardino et al. J Neurosci. .

Abstract

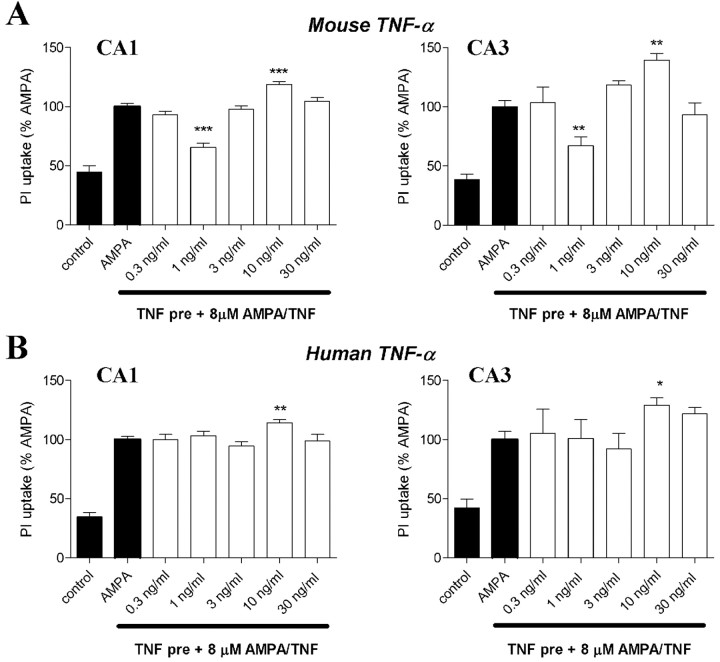
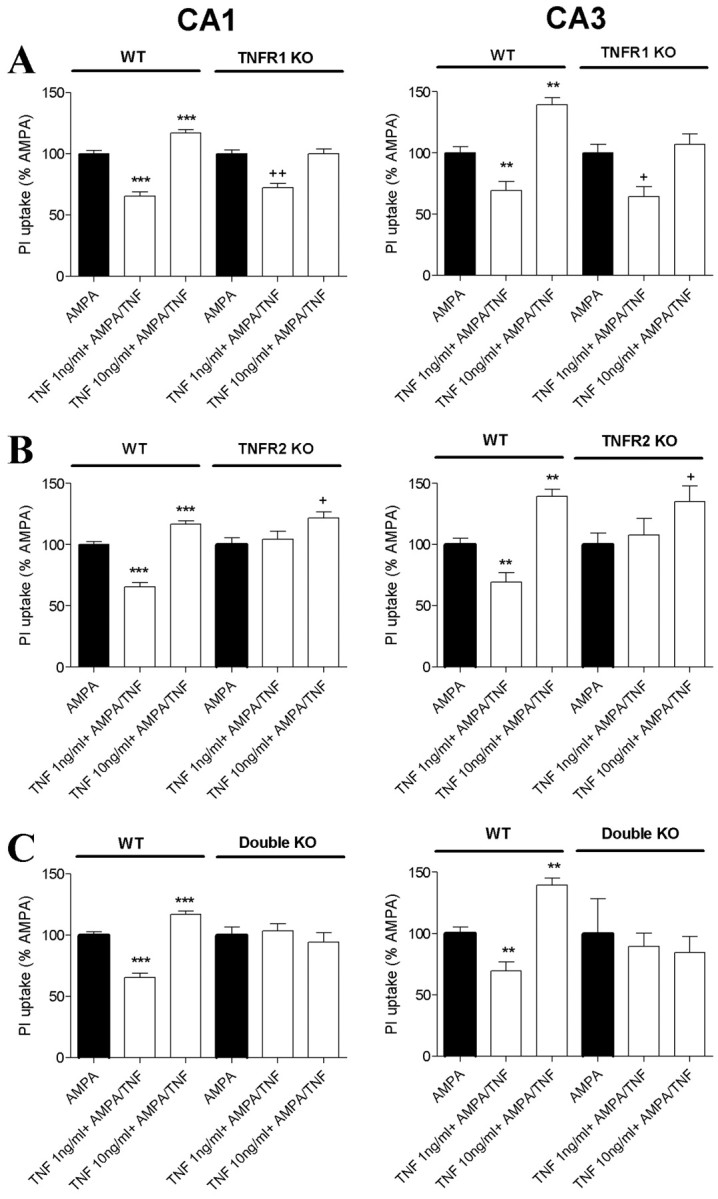
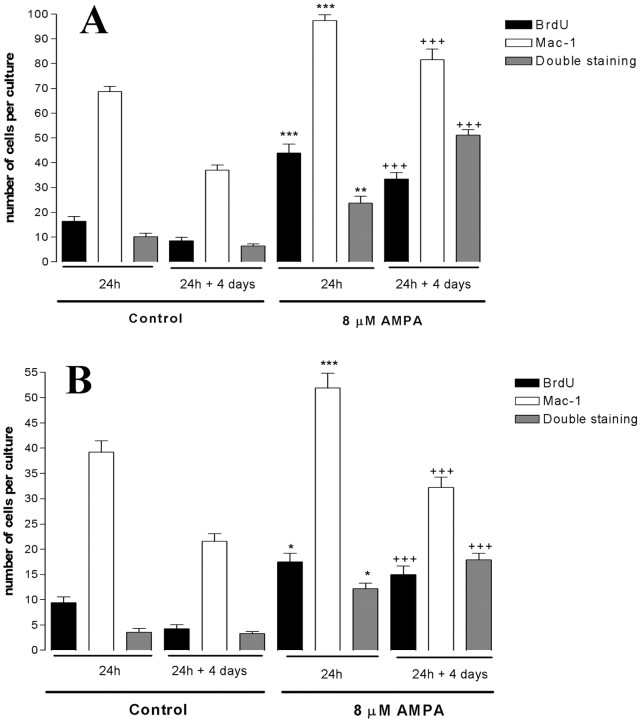
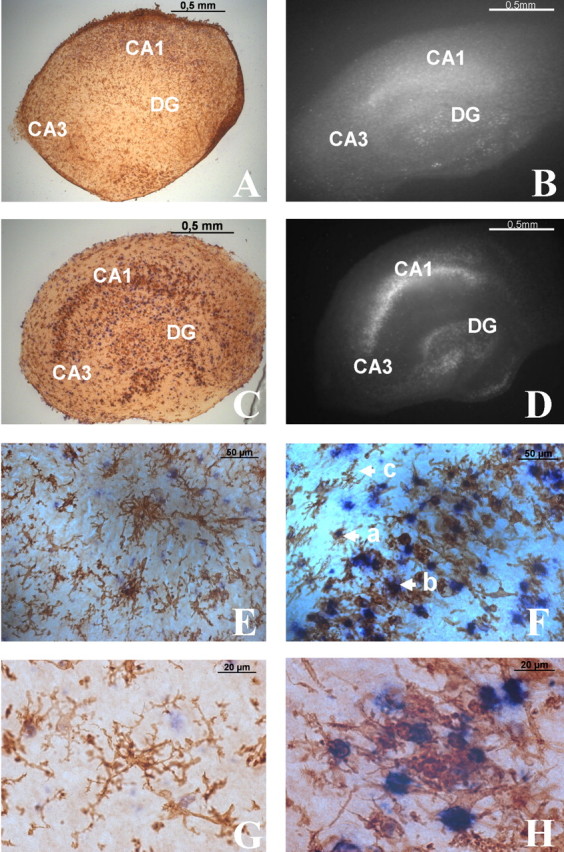
The inflammatory cytokines interleukin-1beta and tumor necrosis factor-alpha (TNF-alpha) have been identified as mediators of several forms of neurodegeneration in the brain. However, they can produce either deleterious or beneficial effects on neuronal function. We investigated the effects of these cytokines on neuronal death caused by exposure of mouse organotypic hippocampal slice cultures to toxic concentrations of AMPA. Either potentiation of excitotoxicity or neuroprotection was observed, depending on the concentration of the cytokines and the timing of exposure. A relatively high concentration of mouse recombinant TNF-alpha (10 ng/ml) enhanced excitotoxicity when the cultures were simultaneously exposed to AMPA and to this cytokine. Decreasing the concentration of TNF-alpha to 1 ng/ml resulted in neuroprotection against AMPA-induced neuronal death independently on the application protocol. By using TNF-alpha receptor (TNFR) knock-out mice, we demonstrated that the potentiation of AMPA-induced toxicity by TNF-alpha involves TNF receptor-1, whereas the neuroprotective effect is mediated by TNF receptor-2. AMPA exposure was associated with activation and proliferation of microglia as assessed by macrophage antigen-1 and bromodeoxyuridine immunohistochemistry, suggesting a functional recruitment of cytokine-producing cells at sites of neurodegeneration. Together, these findings are relevant for understanding the role of proinflammatory cytokines and microglia activation in acute and chronic excitotoxic conditions.


Figures

Figure 1.
Figure 1.
Schematic representation of the protocols used for studying the excitotoxic effects of AMPA (A) and the effects of TNF-α and IL-1β on AMPA-induced neuronal cell death (B) in organotypic hippocampal slice cultures derived from postnatal day 7 C57BL/6 mice. Large arrows, Recordings of PI uptake by photography; small arrows, addition of PI to the medium; dashed lines, exposure to AMPA.
Figure 2.
Figure 2.
AMPA-induced excitotoxicity in organotypic hippocampal slice cultures of mice. A, Fluorescence photomicrographs of PI uptake at day 1 in representative control hippocampal slice cultures, in cultures exposed for 24 h to 8 μm AMPA, and in cultures coexposed to 8 μm AMPA and 15 μm LY303070, a selective AMPA receptor antagonist. Scale bar, 500 μm. B, Densitometry measurements of PI uptake induced by 8 μm AMPA in the CA1 and CA3 pyramidal cell layers and blockade of this effect by 15 μm LY303070. The PI uptake induced by 8 μm AMPA was set to 100%. Data are expressed as mean ± SEM (n = 10-69). ***p < 0.001 using Bonferroni's correction for comparison with control (no-drug exposure). C, Dose-response relationship for increasing concentrations of AMPA (1-30 μm) and cellular PI uptake measured in the DG, in CA1 and CA3 pyramidal cell layers, and in the whole-slice culture (total) after exposure to AMPA for 24 h (d1) and 48 h (d2). The maximal PI uptake in each condition was set to 100%. Data are the mean ± SEM (n = 7).
Figure 3.
Figure 3.
Modulation of AMPA-induced cell death in WT cultured mice hippocampal slices by IL-1β. A, Effects of 1 ng/ml IL-1β on PI uptake in CA1 and CA3 pyramidal cell layers (n = 15-23). B, Effects of 10 ng/ml IL-1β on PI uptake in CA1 and CA3 pyramidal cell layers (n = 6-21). In agreement with Figure 1, IL1 pre represents preincubation starting at day 0; AMPA and AMPA/IL1 represent excitotoxic insult (AMPA) or coexposure of AMPA and IL1 added at day 1. Data are mean ± SEM. ***p < 0.001, **p < 0.01 using ANOVA with Bonferroni's correction for comparison with the effect of 8 μm AMPA (100%).
Figure 4.
Figure 4.
Modulation of AMPA-induced cell death in WT cultured mice hippocampal slices by TNF-α. A, Effects of 1 ng/ml TNF-α on PI uptake in CA1 and CA3 pyramidal cell layers (n = 8-41). B, Effects of 10 ng/ml TNF-α on PI uptake in CA1 and CA3 subfields (n = 9-35). In agreement with Figure 1, TNF pre represents preincubation starting at day 0; AMPA and AMPA/TNF represent excitotoxic insult (AMPA) or coexposure of AMPA and TNF-α added at day 1. Data are mean ± SEM. *p < 0.05, **p < 0.01, and ***p < 0.001 using ANOVA with Bonferroni's correction for comparison with the effect of 8 μm AMPA (100%).
Figure 5.
Figure 5.
Dose-response relationship for increasing concentrations of mouse (A) or human (B) TNF-α (0.3-30 ng/ml) on AMPA-induced PI uptake, measured in CA1 and CA3 subfields of WT cultured mice hippocampal slices. A, Effects of mouse TNF-α on PI uptake in CA1 and CA3 subfields (n = 6-86). TNF pre represents preincubation starting at day 0, and AMPA/TNF represents coexposure of AMPA and TNF-α added at day 1. B, Effects of human TNF-α on PI uptake in CA1 and CA3 subfields (n= 6-29). TNF pre represents preincubation starting at day 0, and AMPA/TNF represents coexposure of AMPA and TNF-α added at day 1. Data are mean ± SEM. *p < 0.05, **p < 0.01, and ***p < 0.001, using ANOVA with Bonferroni's correction for comparison with the effect of 8 μm AMPA set at 100%.
Figure 6.
Figure 6.
Effects of TNF-α on AMPA-induced cell death in organotypic hippocampal slice cultures from WT or KOC57BL/6 mice lacking TNFR1, TNFR2, or both. A, Effects of 1 or 10 ng/ml TNF-α on AMPA-induced PI uptake in CA1 (left column) and CA3 (right column) subfields (n = 38-91) in hippocampal slices of WT or TNFR1KO. B, Effects of 1 or 10 ng/ml TNF-α on AMPA-induced PI uptake in CA1 (left column) and CA3 (right column) subfields (n = 23-86) in hippocampal slices of WT or TNFR2 KO. C, Effects of 1 or 10 ng/ml TNF-α on AMPA-induced PI uptake in CA1 (left column) and CA3 (right column) subfields (n = 13-86) in hippocampal slices of WT or double KO (TNFR1 and TNFR2). Data are mean ± SEM. **p < 0.01 and ***p < 0.001 using ANOVA with Bonferroni's correction for comparison with the effect of 8 μm AMPA (set at 100%) in WT slice cultures; +p < 0.05 and ++p < 0.01 using ANOVA with Bonferroni's correction for comparison with effect of 8 μm AMPA (set at 100%) in the respective KO slice cultures.
Figure 7.
Figure 7.
Stereological cell counts of Mac-1-positive microglial cells and BrdU-labeled cells in slice cultures exposed to AMPA. Anti-Mac-1, anti-BrdU, and double anti-Mac-1/anti-BrdU-positive cells were counted in control cultures and in cultures exposed to 8 μm AMPA for 24 h with or without an additional 4 d of recovery in normal culture medium. Counts were performed in CA1 (A) and CA3 (B) pyramidal cell layers. Data are expressed as the average number of cells per culture ± SEM. *p < 0.05; **p < 0.01; ***p < 0.001, using ANOVA with Bonferroni's correction for comparison with the average number of cells in control slices exposed to normal medium for 24 h; +++p < 0.001 using ANOVA with Bonferroni's correction for comparison with the average number of cells in control slices exposed to normal medium for 5 d.
Figure 8.
Figure 8.
Morphological changes of Mac-1-positive microglial cells from resting to activated state in mouse hippocampal slice cultures exposed to AMPA. A-D, Localization of Mac-1/BrdU double staining (A, C) and PI uptake (B, D) in control culture (A, B) and culture exposed to 8 μm AMPA for 24 h, followed by 4 d of recovery in normal medium (C, D). The control cultures (A, B) display a random distribution of resting microglia, sporadic BrdU-positive cells (A), and low-basal PI uptake (B). Cultures exposed to 8 μm AMPA (C, D) display increased numbers of microglia and BrdU-positive cells in the lesion areas (CA1 and CA3; C) and a concomitant increase of PI uptake in the same subfields (D). E, Resting microglia in a control slice culture showing sporadic BrdU-positive cells. G, High-power photomicrograph of microglia stained for anti-Mac-1 located in CA1 pyramidal cell layer. Reactive microglia and an increase in the number of anti-BrdU-positive cells following 8 μm AMPA are shown. F, a, Double-labeled Mac-1 and BrdU-positive cell; b, activated Mac-1-positive cell; c, resting-like Mac-1-positive cell. H, High-power photomicrograph of labeled anti-BrdU-positive microglial cell located in CA1 pyramidal cell layer.

Similar articles

Cited by

References

    1. Allan SM, Rothwell NJ (2001) Cytokines and acute neurodegeneration. Nat Rev Neurosci 2: 734-744. - PubMed
    1. Balosso S, Ravizza T, Perego C, Peschon J, Campbell IL, De Simoni MG, Vezzani A (2005) Tumor necrosis factor-α inhibits seizures in mice via p75 receptors. Ann Neurol 57: 804-812. - PubMed
    1. Barger SW, Horster D, Furukawa K, Goodman Y, Krieglstein J, Mattson MP (1995) Tumor necrosis factors alpha and beta protect neurons against amyloid beta-peptide toxicity: evidence for involvement of a kappaB-binding factor and attenuation of peroxide and Ca2+ accumulation. Proc Natl Acad Sci USA 92: 9328-9332. - PMC - PubMed
    1. Beattie EC, Stellwagen D, Morishita W, Bresnahan JC, Ha BK, Von Zastrow M, Beattie MS, Malenka RC (2002) Control of synaptic strength by glial TNFalpha. Science 295: 2282-2285. - PubMed
    1. Beattie MS (2004) Inflammation and apoptosis: linked therapeutic targets in spinal cord injury. Trends Mol Med 10: 580-583. - PubMed

Publication types

MeSH terms

Substances

LinkOut - more resources