. 2005 Jul 20;25(29):6797-806.
doi: 10.1523/JNEUROSCI.1571-05.2005.

Nonauditory events of a behavioral procedure activate auditory cortex of highly trained monkeys

Affiliations

Nonauditory events of a behavioral procedure activate auditory cortex of highly trained monkeys

Michael Brosch et al. J Neurosci. .

Abstract

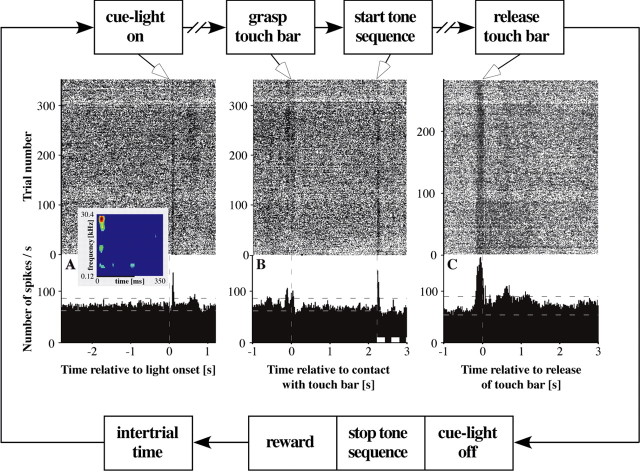
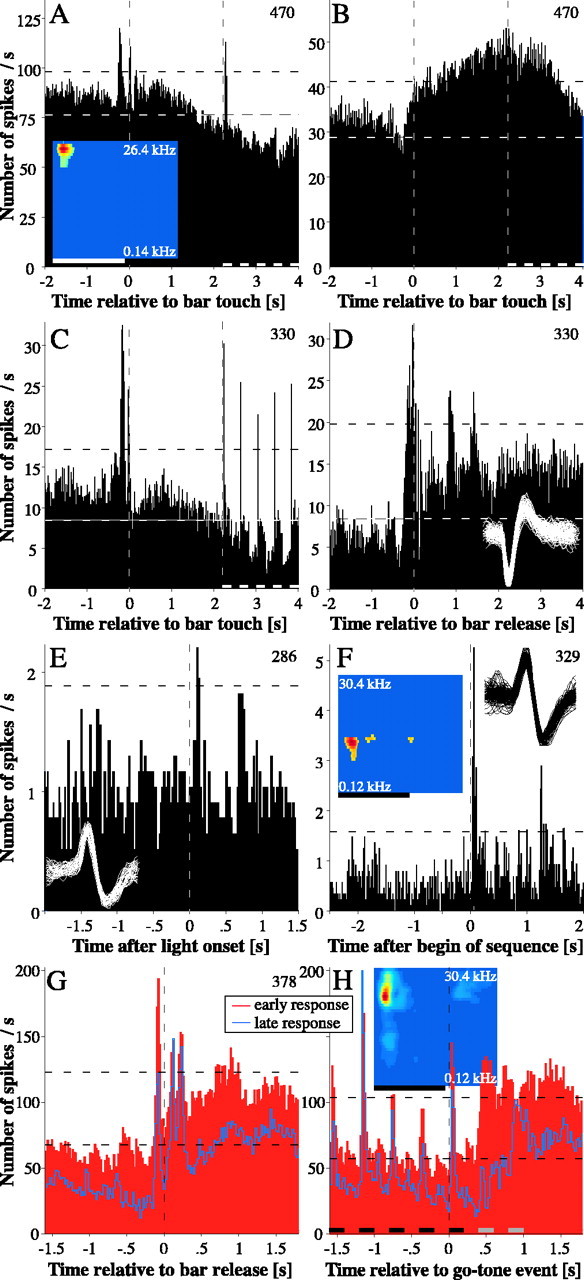
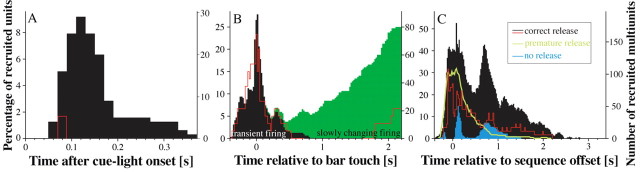
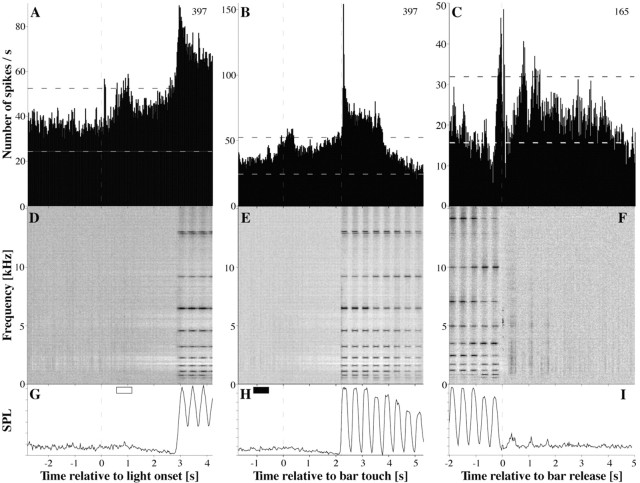
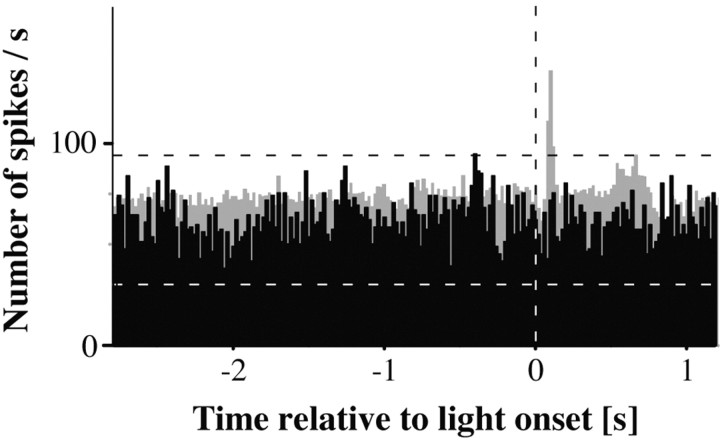
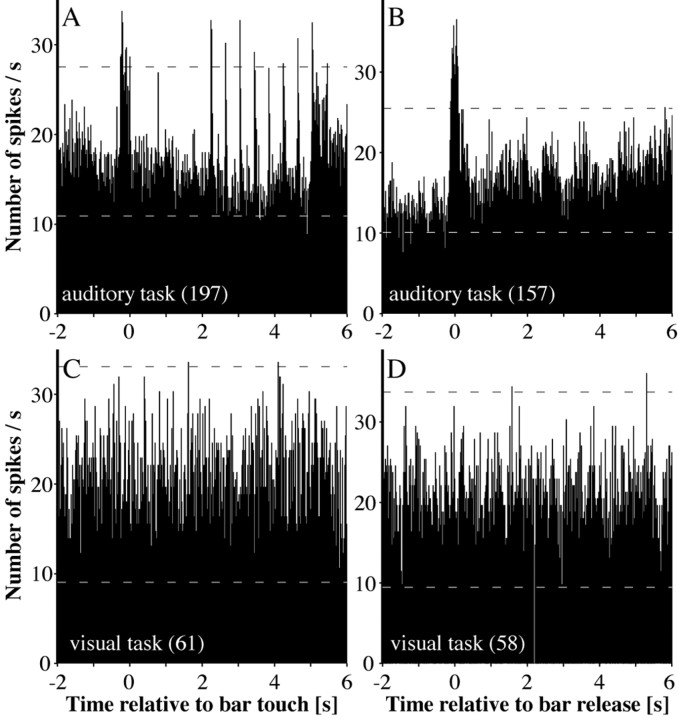
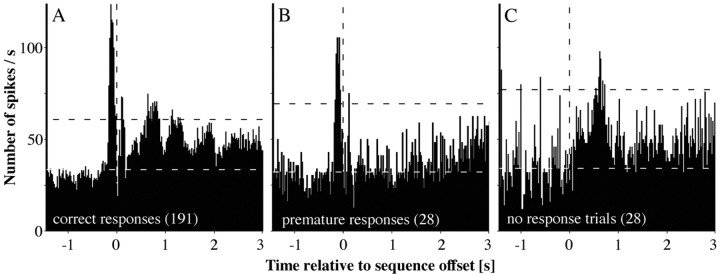
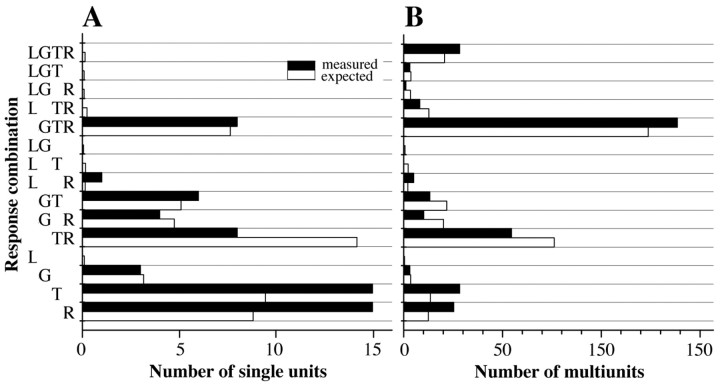
A central tenet in brain research is that early sensory cortex is modality specific, and, only in exceptional cases, such as deaf and blind subjects or professional musicians, is influenced by other modalities. Here we describe extensive cross-modal activation in the auditory cortex of two monkeys while they performed a demanding auditory categorization task: after a cue light was turned on, monkeys could initiate a tone sequence by touching a bar and then earn a reward by releasing the bar on occurrence of a falling frequency contour in the sequence. In their primary auditory cortex and posterior belt areas, we found many acoustically responsive neurons whose firing was synchronized to the cue light or to the touch or release of the bar. Of 315 multiunits, 45 exhibited cue light-related firing, 194 exhibited firing that was related to bar touch, and 268 exhibited firing that was related to bar release. Among 60 single units, we found one neuron with cue light-related firing, 21 with bar touch-related firing, and 36 with release-related firing. This firing disappeared at individual sites when the monkeys performed a visual detection task. Our findings corroborate and extend recent findings on cross-modal activation in the auditory cortex and suggests that the auditory cortex can be activated by visual and somatosensory stimulation and by movements. We speculate that the multimodal corepresentation in the auditory cortex has arisen from the intensive practice of the subjects with the behavioral procedure and that it facilitates the performance of audiomotor tasks in proficient subjects.


Figures

Figure 1.
Figure 1.
Multiunit in primary auditory cortex that fired action potentials during acoustic and nonacoustic events of an auditory categorization task. The outer flow diagram depicts details of the behavioral task. Inner panels show dots raster grams and PETHs computed from the neuronal discharges, which were temporally aligned to the onset of the cue light (A), the bar touch and the onset of the tone sequence (B), and the release of the touch bar (C). The number of trials is given in the top right corner of each panel. C was computed from trials with correct responses only. The dashed horizontal lines mark 3 SDs above and below average baseline firing, computed from the period of 1800 ms before light onset. In A, the inset shows the response plane of this unit, computed from the spikes that, after the behavioral task, were recorded during the presentation of pure tones within the frequency range of tones indicated on the ordinate. The black bar denotes tone duration. For graphical purposes, the response plane was truncated 350 ms after tone onset. The dark blue color codes the average spike rate during the intertone intervals. Spike rates that are significantly above this rate are plotted with warmer colors. In B, the white bars mark the first and the second tone in the sequence.
Figure 2.
Figure 2.
Additional examples of single units and multiunits that fired during acoustic and nonacoustic events. Same conventions as in Figure 1. A, Multiunit with a slow decrease of firing during the bar-holding period. The two narrow peaks at approximately zero indicate transient firing synchronized to bar touch. The single peak 2.22 s after bar touch indicates the response to only the first tone in the sequence. B, Multiunit with a slow increase of firing during the bar-holding period. This unit could not be driven by tones during and after the auditory discrimination task, and therefore no response plane is shown. The multiunits displayed in A and B were simultaneously recorded from different electrodes. C, D, Single unit that fired during acoustic and nonacoustic events. This unit responded to tones between 0.4 and 20 kHz during the auditory discrimination task. Inset in D shows spike waveforms. E, Single unit that fired 80-120 ms after onset of the cue light. This unit could not be driven by tones during or after the auditory discrimination task. F, Single unit that fired only to acoustic stimuli. Note that this unit responded only to the first and fourth tone of the sequence. G, H, Identification of events to which the responses of a multiunit were synchronized, using trials in which the monkey released the touch bar early (red bars) or late (blue curve) after the go event. In G, neuronal responses for early and late behavioral responses are in register only around and after the time of bar release. In H, neuronal responses for early and late behavioral responses are register only during the tone sequence. The bars underneath the abscissa indicate the tones. The last bars are rendered differently because, in some trials, the monkey had stopped the sequence before the second or third low-frequency tone in the sequence. For additional details, see Results.
Figure 3.
Figure 3.
Recruitment of units during nonacoustic events of the auditory categorization task. Recruitment (expressed as the percentage or number of units with a significantly modified firing rate in a given bin) is shown for multiunits (black bars) and single units (red curves) relative to the onset of the cue light (A), to bar touch (B), and to sequence offset (C). In C, the black bars and the red curve give recruitment for trials with correct responses. This panel also shows recruitment of multiunits in trials with premature (green curve) and no responses (blue bars). In correct and premature trials, monkeys released the bar, and the cue light and tone sequences were turned off at sequence offset. In no-response trials, only the cue light was turned off at sequence offset.
Figure 4.
Figure 4.
Firing synchronized to acoustic and nonacoustic events and measurements of sounds synchronized to these events. The top panels show PETHs synchronized to the event indicated on the abscissa. PETHs in A and B are from the same multiunit. This unit responded to tones between 0.4 and 13 kHz during the auditory categorization task. In C, the PETH was calculated from trials in which the monkey responded correctly 100-200 ms after the end of the last tone in the tone sequence. This unit responded to tones between 0.7 and 20 kHz during the auditory categorization task. The panels in the middle row show corresponding spectrograms computed from the sounds that were recorded, parallel with the spikes, with a calibrated microphone in the experimental room. For the calculation of the spectrograms, each 7 s time period around a given event was divided into 301 overlapping 2048 point (46.4 ms) time windows with a shift interval of 1024 points. Each time window was tapered with a three-term Blackman-Harris window to reduce the high-frequency artifacts induced by the sectioning of the data. A discrete Fourier transform algorithm was then used to calculate the power in each frequency bin. Subsequently, the spectrograms of all events of a given type were summed. For graphical purposes only, we accounted for the 1/f spectrum by subtracting from the spectrogram the mean amplitude in each frequency bin, which was calculated from all time bins in the period of 1355 ms before light onset. The resulting spectrogram was plotted on a map in which the sound pressure level for a given frequency/time pair was proportional to the gray value of the corresponding pixel. In D and E, the gray scale covers a range from 0 to 42 dB SPL. The range was 37 dB in F. Because of the averaging across sequences with different frequencies, the maximal SPL in the plots is less than the SPL of the individual tones (∼60 dB) used in individual trials. In E, the series of dark bars indicates the tones in the sequences, which commenced 2.22 s after bar touch, had a duration of 200 ms, and were played at 10 different frequencies with equal logarithmic spacing. The representation of the tones in D and F is blurred because the spectrograms are not synchronized to tone onsets. In F, note the 5 kHz noise band at the zero time bin, representing the noise produced by the water delivery system outside the experimental room, and the three bands around the time bins at 360, 1080, and 1720 ms, representing the licking sounds. The bottom row shows time courses of the integrated sound pressure level relative to the event indicated on the abscissa. They were computed by summing the sound pressure levels of all frequency bins at each time bin in the spectrogram shown in D-F. In G, the open rectangle marks the 95% time range of the monkey's response to the cue light. In H, the filled rectangle denotes the respective value of the cue light relative to bar touch.
Figure 5.
Figure 5.
Performance dependence of cue light-related firing in auditory cortex. The PETH computed from 41 trials in which the monkey did not touch the bar while the cue light was on is plotted in black. The PETH for the 352 trials in which the monkey made contact with the touch bar after the cue light was lit is plotted in gray and is the same as the PETH shown in Figure 1 A. Note that the peak 60-100 ms after onset of the cue light was present only in trials with subsequent grasping responses.
Figure 6.
Figure 6.
Task dependence of grasping-related and release-related firing of a multiunit in auditory cortex. The left column shows PETHs triggered on the moment the monkey grasped the touch bar. The right column shows PETHs temporally aligned to bar release. The upper tier shows PETHs while the monkey performed the auditory categorization task (i.e., discriminated falling from rising pitch directions). The lower tier shows PETHs during the performance of the visual detection task (i.e., when the monkey detected the onset of the blinking of the LED). All PETHs were calculated from correct responses only. Note that significant modulations of firing are seen only in the auditory task condition.
Figure 7.
Figure 7.
Firing of a multiunit in trials with correct (A), premature (B), and no (C) behavioral responses that were synchronized to sequence offset. Note that there were two narrow peaks in the PETHs of A and B shortly before and after bar release but not in no-response trials (C). Late peaks were present only in trials with correct responses (A) but not in premature trials (B). This unit responded to tones between 0.7 and 22 kHz during the tone discrimination task. For additional details, see Results.
Figure 8.
Figure 8.
Relationship between different neuronal response properties in single units (A) and multiunits (B). Letters denote firing related to the cue light (L), grasping (G), tone sequence (T), and bar release (R). The black bars denote the actual numbers that were observed in our sample. The white bars denote the number of cases that were expected under the assumption that the four properties were statistically independent.

Similar articles

Cited by

References

    1. Bangert M, Haeusler U, Altenmuller E (2001) On practice: how the brain connects piano keys and piano sounds. Ann NY Acad Sci 930: 425-428. - PubMed
    1. Beaton R, Miller JM (1975) Single cell activity in the auditory cortex of the unanesthetized, behaving monkey: correlation with stimulus controlled behavior. Brain Res 100: 543-562. - PubMed
    1. Beitel RE, Schreiner CE, Cheung SW, Wang X, Merzenich MM (2003) Reward-dependent plasticity in the primary auditory cortex of adult monkeys trained to discriminate temporally modulated signals. Proc Natl Acad Sci USA 100: 11070-11075. - PMC - PubMed
    1. Benson DA, Hienz RD (1978) Single-unit activity in the auditory cortex of monkeys selectively attending left vs. right ear stimuli. Brain Res 159: 307-320. - PubMed
    1. Bronchti G, Heil P, Sadka R, Hess A, Scheich H, Wollberg Z (2002) Auditory activation of “visual” cortical areas in the blind mole rat (Spalax ehren-bergi). Eur J Neurosci 16: 311-329. - PubMed

Publication types

LinkOut - more resources