. 2005 Jul 20;25(29):6826-35.
doi: 10.1523/JNEUROSCI.0945-05.2005.

Synaptically driven endocannabinoid release requires Ca2+-assisted metabotropic glutamate receptor subtype 1 to phospholipase Cbeta4 signaling cascade in the cerebellum

Affiliations

Synaptically driven endocannabinoid release requires Ca2+-assisted metabotropic glutamate receptor subtype 1 to phospholipase Cbeta4 signaling cascade in the cerebellum

Takashi Maejima et al. J Neurosci. .

Abstract

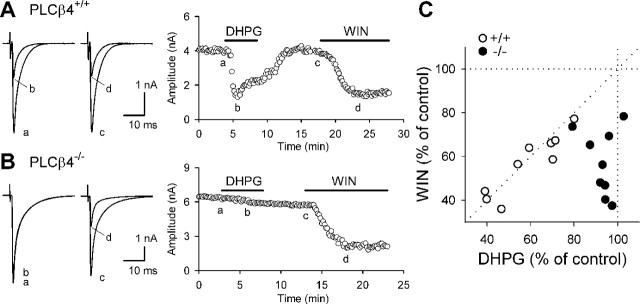
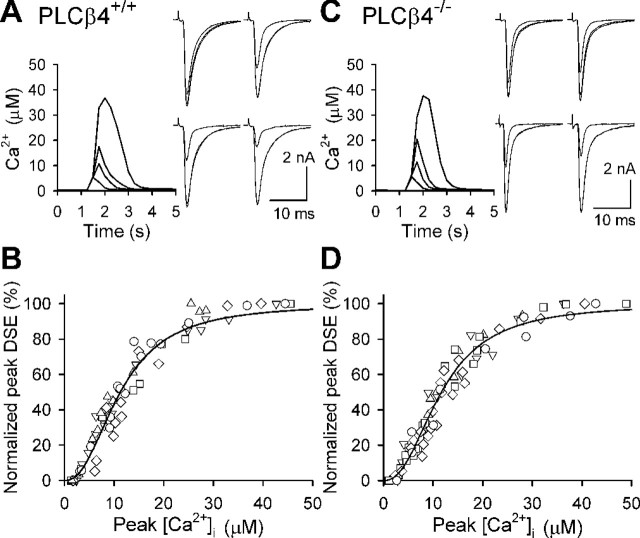
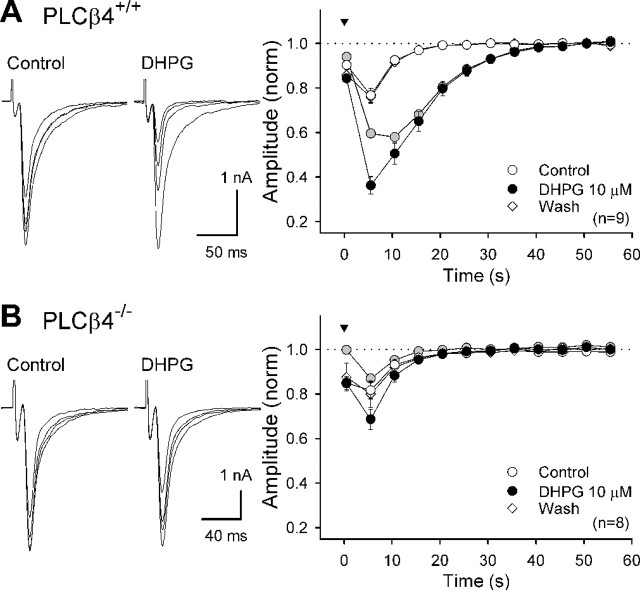
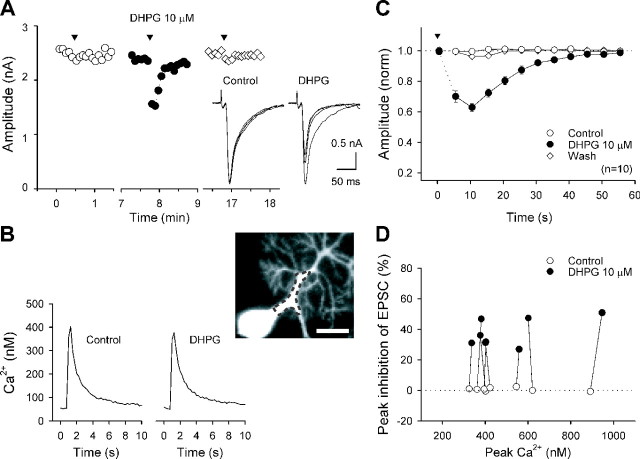
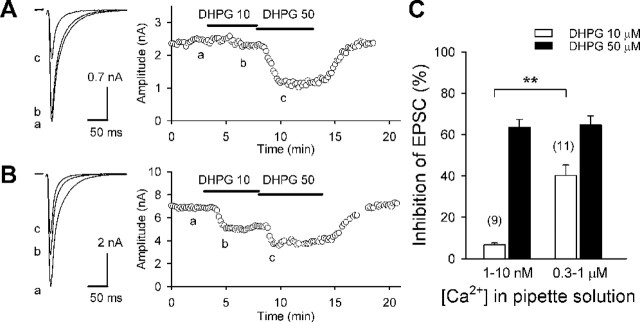
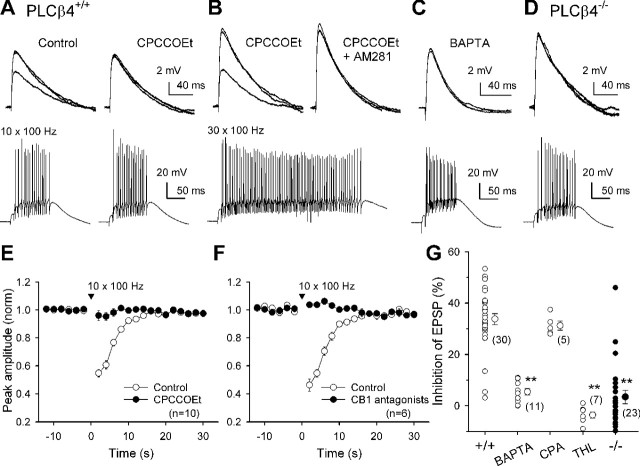
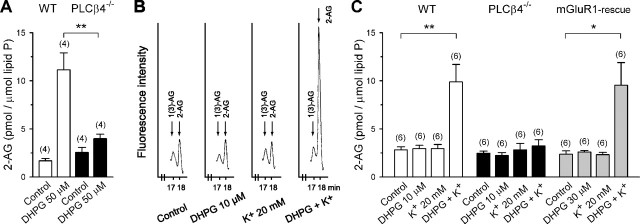
Endocannabinoids mediate retrograde signaling and modulate synaptic transmission in various regions of the CNS. Depolarization-induced elevation of intracellular Ca2+ concentration causes endocannabinoid-mediated suppression of excitatory/inhibitory synaptic transmission. Activation of G(q/11)-coupled receptors including group I metabotropic glutamate receptors (mGluRs) also causes endocannabinoid-mediated suppression of synaptic transmission. However, precise mechanisms of endocannabinoid production initiated by physiologically relevant synaptic activity remain to be determined. To address this problem, we made whole-cell recordings from Purkinje cells (PCs) in mouse cerebellar slices and examined their excitatory synapses arising from climbing fibers (CFs) and parallel fibers (PFs). We first characterized three distinct modes to induce endocannabinoid release by analyzing CF to PC synapses. The first mode is strong activation of mGluR subtype 1 (mGluR1)-phospholipase C (PLC) beta4 cascade without detectable Ca2+ elevation. The second mode is Ca2+ elevation to a micromolar range without activation of the mGluR1-PLCbeta4 cascade. The third mode is the Ca2+-assisted mGluR1-PLCbeta4 cascade that requires weak mGluR1 activation and Ca2+ elevation to a submicromolar range. By analyzing PF to PC synapses, we show that the third mode is essential for effective endocannabinoid release from PCs by excitatory synaptic activity. Furthermore, our biochemical analysis demonstrates that combined weak mGluR1 activation and mild depolarization in PCs effectively produces 2-arachidonoylglycerol (2-AG), a candidate of endocannabinoid, whereas either stimulus alone did not produce detectable 2-AG. Our results strongly suggest that under physiological conditions, excitatory synaptic inputs to PCs activate the Ca2+-assisted mGluR1-PLCbeta4 cascade, and thereby produce 2-AG, which retrogradely modulates synaptic transmission to PCs.


Figures

Figure 1.
Figure 1.
PLCβ4 is required for mGluR1-driven endocannabinoid release. CF-EPSCs were recorded from PCs of wild-type mice (PLCβ4+/+) (A) and PLCβ4-deficient mice (PLCβ4-/-) (B). A, B, Representative results showing the effects of bath-applied DHPG (50 μm) and WIN (5 μm) on CF-EPSCs. Sample EPSC traces (left; a, b, c, d) were obtained at the time points indicated in the corresponding graphs (right) showing the time courses of changes in CF-EPSC amplitudes. Each sample trace is the average of six consecutive EPSCs. C, Scatter plots showing the correlation between the effects of 50 μm DHPG and 5 μm WIN on EPSC amplitudes.
Figure 2.
Figure 2.
PLCβ4 is not required for depolarization-induced endocannabinoid release. CF-EPSCs were recorded from PCs of wild-type mice (PLCβ4+/+) (A, B) and PLCβ4-deficient mice (PLCβ4-/-) (C, D). A, C, Examples of simultaneous recordings of Ca2+ transients (left) and DSE induced by PC depolarization with various durations. Ca2+ transients were detected with fura-FF at the proximal dendrites of PCs. The durations of depolarizing voltage steps were 200, 300, 400, and 750 (A) or 1000 ms (C). Three EPSC traces obtained 5 s before and 5 and 60 s after the depolarization are superimposed. B, D, Scatter plots showing the relationship between peak [Ca2+]i and the normalized value of peak DSE. The peak DSE was calculated as [1 - (EPSC2/EPSC1)] × 100%, where EPSC1 is the average baseline EPSC amplitude, and EPSC2 is the amplitude obtained 5 s after depolarization and was normalized to DSEmax in each cell. Data were obtained from five cells for each strain of mice, and each symbol indicates the data from the same cell. Pooled data are fitted with the Hill equation. Half-maximum DSE occurred at 11.2 μm Ca2+ in wild-type mice (B) and at 11.7 μm Ca2+ in PLCβ4-/- mice (D). The Hill coefficient was 2.3 for both strains.
Figure 3.
Figure 3.
Lack of DHPG-induced enhancement of DSE in PLCβ4-/- mice. CF-EPSCs were recorded from PLCβ4+/+ (A) and PLCβ4-/- (B) PCs. DSE was induced by a short-voltage step (100 ms; 0 mV; arrowhead). Averaged data for time courses of depolarization-induced changes in EPSC amplitude before (Control), during (DHPG 10 μm), and after (Wash) DHPG application are superimposed. The amplitude was normalized (norm) to the value before depolarization. Gray circles indicate differences between the normalized amplitudes before and during DHPG application. Left, Four CF-EPSCs obtained 5 s before and 5, 10, and 15 s after depolarization are superimposed in the presence or absence of DHPG.
Figure 4.
Figure 4.
Endocannabinoid release by conjoint mild mGluR1 activation and Ca2+ elevation to a submicromolar range. The internal solution containing 5 mm BAPTA was used to reduce Ca2+ transients. CF-EPSCs and Ca2+ signals detected by fura-2 were simultaneously recorded. A, B, A representative experiment showing effects of 10 μm DHPG on changes in EPSC amplitudes (A) and Ca2+ transients (B) induced by a 75 ms voltage step. Inset, The Ca2+ signal was measured in the proximal dendrite of a PC and is depicted with a dashed line. Scale bar, 20 μm. C, Averaged time courses of changes in normalized (norm) EPSC amplitude evoked by a 75 or a 100 ms voltage step (0 mV) before (Control), during (DHPG 10 μm), and after (Wash) DHPG application. D, Summary plots showing the results of simultaneous recordings. Peak inhibition of EPSC was calculated from the EPSC amplitude obtained 10 s after depolarization and plotted against peak [Ca2+]i. Data from the same PCs obtained before and during DHPG application are connected with lines.
Figure 5.
Figure 5.
Ca2+ dependence of endocannabinoid release induced by mild mGluR1 activation. CF-EPSCs were recorded from PCs dialyzed with pipette solutions containing various concentrations of CaCl2 and 30 mm BAPTA. A, B, Representative results showing the effects of bath application of 10 or 50 μm DHPG on CF-EPSCs. Sample EPSC traces (left; a, b, c) were obtained at the time points indicated in the corresponding graphs (right) showing the time courses of changes in CF-EPSC amplitudes. A, B, The calculated free Ca2+ concentration of the pipette solution was 1 nm (A) and 1 μm (B). C, Summary bar graph showing DHPG-induced suppression of EPSCs with the pipette solutions containing nominal [Ca2+] of 1 nm (n = 3), 10 nm (n = 6), 300 nm (n = 5), and 1000 nm (n = 6). Because the data obtained with 1 and 10 nm Ca2+ were identical, and those obtained with 300 and 1000 nm Ca2+ were not different, they were collectively shown as [Ca2+] of 1-10 nm (n = 9) and of 0.3-1 μm (n = 11), respectively.
Figure 6.
Figure 6.
A physiological range of PF activity can trigger the endocannabinoid signal through the mGluR1-PLCβ4 pathway. Effects of repetitive PF stimulation on PF-EPSPs recorded from PLCβ4+/+ (A-C) and PLCβ4-/- (D) PCs. A-D, Superimposed EPSP traces recorded 2 s before and 2 and 30 s after a PF burst (top) and the corresponding responses of a PC during the burst (bottom). A, A brief PF burst (10 stimuli at 100 Hz) transiently inhibited PF-EPSPs in control (left) but not in the presence of 100 μm CPCCOEt (right). B, Even in the presence of CPCCOEt, a stronger PF burst (30 stimuli at 100 Hz) induced transient inhibition (left), which was blocked by 2 μm AM281 (right). A and B were sequentially obtained. C, D, The brief PF burst failed to induce the inhibition in PCs dialyzed with the solution containing 30 mm BAPTA (C) and in PLCβ4-/- PCs (D). E, F, Effects of repetitive PF stimulation (10 stimuli at 100 Hz) on PF-EPSPs recorded from PCs. Averaged time courses of changes in peak amplitude of PF-EPSPs obtained in the indicated conditions. Data obtained in the presence of CB1 antagonists AM281 (2 μm) or SR141716A (2 μm) were pooled. G, Summary plots showing the magnitude of inhibition induced by a brief PF burst (10 stimuli; 100 Hz) under the indicated conditions. Magnitudes of inhibition were calculated from the mean amplitude of EPSPs obtained 2, 4, and 6 s after PF burst against that obtained before the burst. In each PC, the most effective site of stimulation was selected from several sites and more than three trials were conducted, and the average is plotted. **p < 0.01 versus wild-type control; t test.
Figure 7.
Figure 7.
PLCβ4 is required for 2-AG production induced by mGluR1 activation with or without mild depolarization. Cerebellar slices were stimulated by adding the reagents for 30 s in the presence of tetrodotoxin (1 μm). Amounts of 2-AG were normalized with the amount of lipid phosphorus (lipid P) measured from each total of lipids extracts. A, Summary bar graph showing the effects of a high dose of DHPG (50 μm) on 2-AG contents of wild-type (WT) and PLCβ4-/- slices. B, Specimen HPLC traces showing the parts of 2-AG and 1(3)-AG retention time from whole-separation profiles of various species of standard monoacylglycerols. The data set was obtained from consecutive measurements of four samples from wild-type mice after the treatments as indicated below the traces. C, Summary bar graph showing the effects of lower doses of DHPG (10 or 30 μm), 20 mm K+, and their combination on 2-AG contents of WT, PLCβ4-/-, and mGluR1-rescue slices.

Similar articles

Cited by

References

    1. Aiba A, Kano M, Chen C, Stanton ME, Fox GD, Herrup K, Zwingman TA, Tonegawa S (1994) Deficient cerebellar long-term depression and impaired motor learning in mGluR1 mutant mice. Cell 79: 377-388. - PubMed
    1. Alger BE (2002) Retrograde signaling in the regulation of synaptic transmission: focus on endocannabinoids. Prog Neurobiol 68: 247-286. - PubMed
    1. Bisogno T, Howell F, Williams G, Minassi A, Cascio MG, Ligresti A, Matias I, Schiano-Moriello A, Paul P, Williams EJ, Gangadharan U, Hobbs C, Di Marzo V, Doherty P (2003) Cloning of the first sn1-DAG lipases points to the spatial and temporal regulation of endocannabinoid signaling in the brain. J Cell Biol 163: 463-468. - PMC - PubMed
    1. Brenowitz SD, Regehr WG (2003) Calcium dependence of retrograde inhibition by endocannabinoids at synapses onto Purkinje cells. J Neurosci 23: 6373-6384. - PMC - PubMed
    1. Brenowitz SD, Regehr WG (2005) Associative short-term synaptic plasticity mediated by endocannabinoids. Neuron 45: 419-431. - PubMed

Publication types

MeSH terms

LinkOut - more resources