. 2005 Jun;7(6):545-55.
doi: 10.1593/neo.04571.

Persistent STAT3 activation in colon cancer is associated with enhanced cell proliferation and tumor growth

Affiliations

Persistent STAT3 activation in colon cancer is associated with enhanced cell proliferation and tumor growth

Florian M Corvinus et al. Neoplasia. 2005 Jun.

Abstract

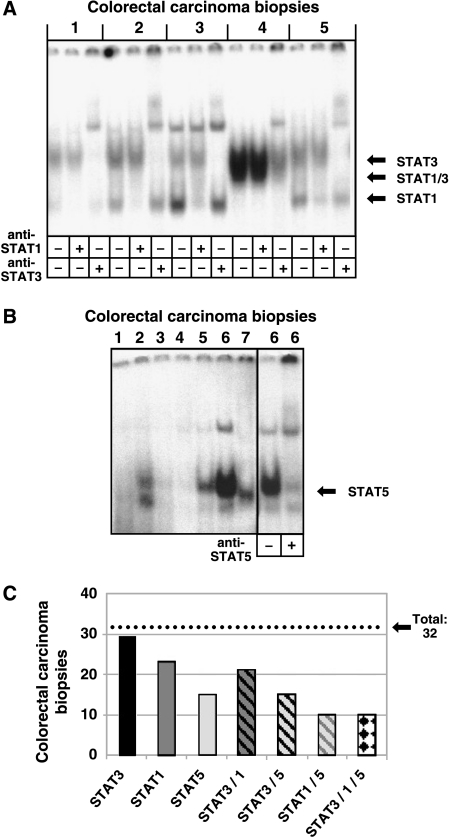
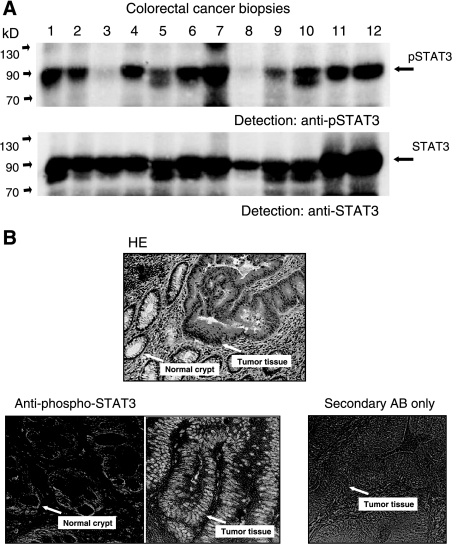
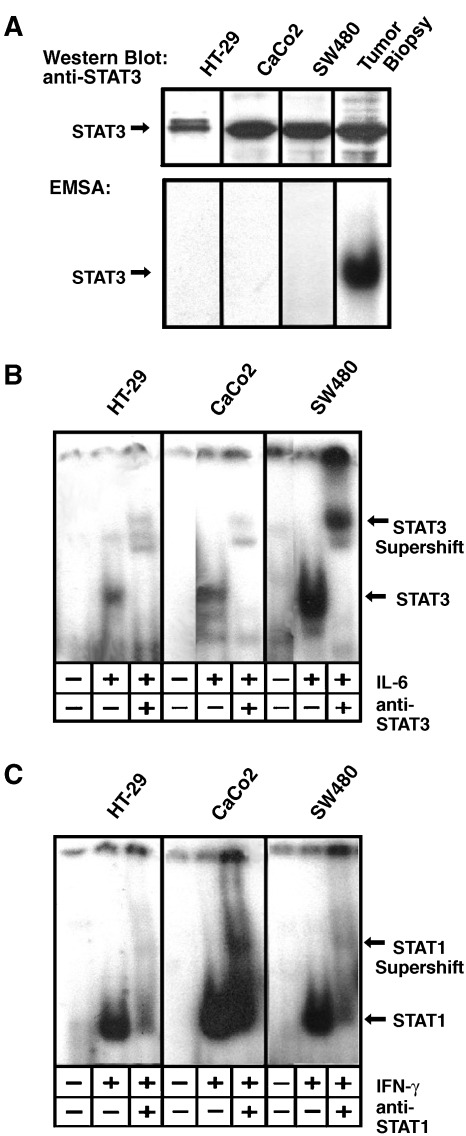
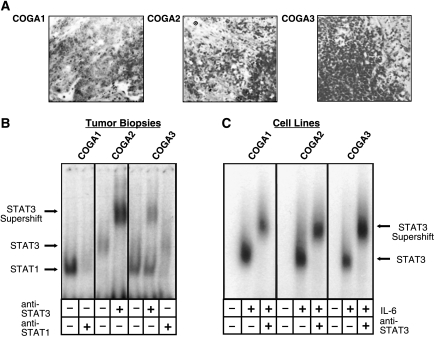
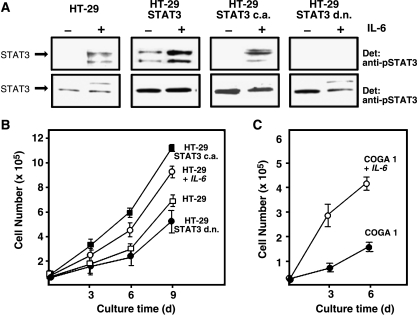
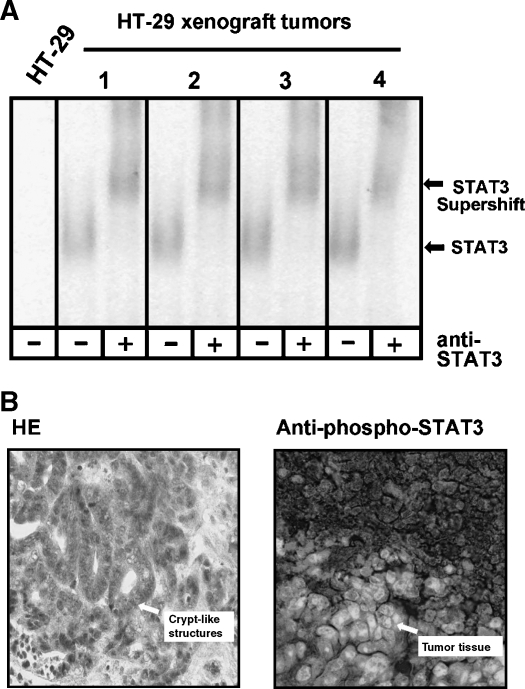
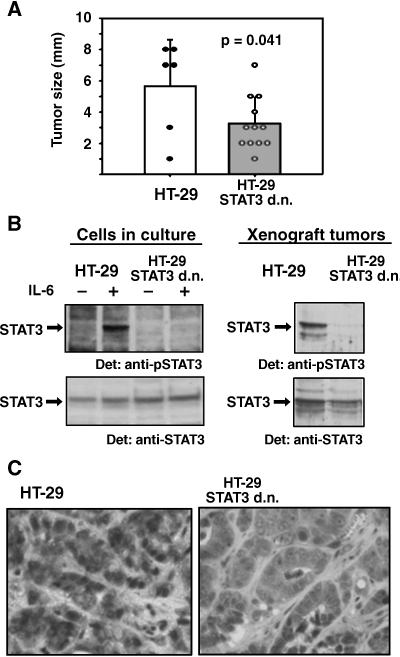
Colorectal carcinoma (CRC) is a major cause of morbidity and mortality in Western countries. It has so far been molecularly defined mainly by alterations of the Wnt pathway. We show here for the first time that aberrant activities of the signal transducer and activator of transcription STAT3 actively contribute to this malignancy and, thus, are a potential therapeutic target for CRC. Constitutive STAT3 activity was found to be abundant in dedifferentiated cancer cells and infiltrating lymphocytes of CRC samples, but not in non-neoplastic colon epithelium. Cell lines derived from malignant colorectal tumors lost persistent STAT3 activity in culture. However, implantation of colon carcinoma cells into nude mice resulted in restoration of STAT3 activity, suggesting a role of an extracellular stimulus within the tumor microenvironment as a trigger for STAT activation. STAT3 activity in CRC cells triggered through interleukin-6 or through a constitutively active STAT3 mutant promoted cancer cell multiplication, whereas STAT3 inhibition through a dominant-negative variant impaired IL-6-driven proliferation. Blockade of STAT3 activation in CRC-derived xenograft tumors slowed down their development, arguing for a contribution of STAT3 to colorectal tumor growth.


Figures

Figure 1
Figure 1
Analysis of STAT activity by EMSA in extracts of colorectal carcinoma biopsies. (A) Extracts from colorectal tumor tissue samples (1–5) were incubated with the double-stranded 32P-labelled SIE m67 STAT binding site. Complexes were resolved on a 6% native polyacrylamide gel and visualized by autoradiography. The identity of STAT-containing complexes was determined by including specific antibodies in the binding reactions as indicated. According to the results from the supershift experiments, positions of the specific STAT complexes are indicated by arrows. (B) Extracts from colorectal tumor biopsies (1–7) were analyzed for the formation of DNA-protein complexes on the 32P-labelled proximal STAT5 binding element from the bovine β-casein promoter. A representative tumor tissue extract (6) was subjected to a supershift experiment by simultaneous incubation with a STAT5-specific antibody as indicated. (C) Incidence of persistent STAT activity in the colorectal tumor samples investigated in this work. Bars represent the respective numbers of biopsies (from 32 individual colorectal tumors) positive for the indicated STAT activity (activities) as analyzed by EMSA.
Figure 2
Figure 2
Analysis of STAT3 tyrosine phosphorylation in colorectal cancer tissue. (A) Examination of lysates from tumor biopsies for activated STAT3 by Western blot analysis. Samples were separated by PAGE, transferred to nitrocellulose, and probed with an antibody specifically recognizing STAT3 phosphorylated on tyrosine 705 (top). Comparable loading of the lanes and identity of STAT3 was confirmed by reprobing the blot with anti-STAT3 (bottom). (B) Histologic examination of a colorectal tumor sample for STAT3 activity. Sections from a representative tumor biopsy were stained with hematoxylin/eosin (top) or immunoreacted with antibody to phospho-STAT3 (bottom). Sections showing differentiated normal cells in crypt structures or dedifferentiated tumor tissues, respectively (arrows), were treated with an antibody specific for STAT3 phosphorylated at tyrosine 705. As a control for antibody and detection specificity, a typical section was stained with peroxidase-coupled secondary antibody without prior treatment with anti-pSTAT3 Tyr 705 (bottom right).
Figure 3
Figure 3
Analysis of the STAT activity status in colon carcinoma cell lines. (A) Western blot analysis (top) and EMSA analysis (bottom) of cell lines HT-29, CaCo2, and SW 480. A STAT3-positive tumor sample (compare Figure 1) served as a positive control. STAT3 expression was tested by subjecting cell extracts to a Western blot probed with anti-STAT3. STAT3 activation was analyzed by assaying for the formation of specific complexes on the SIE m67 DNA binding site. (B) Test for IL-6-inducible activation of STAT3 in cell lines HT-29, CaCo2, and SW 480. Cells were either left untreated or incubated with 10 ng/ml IL-6 for 30 minutes as indicated. Lysates were subjected to an EMSA using the m67 element as a probe. The identity of STAT3-containing complexes was verified by supershift experiments employing an antibody to STAT3 as indicated. Positions of STAT3 and STAT3-DNA complexes are marked with arrows. (C) Test for IFN-γ-inducible activation of STAT3 in cell lines HT-29, CaCo2, and SW 480. Cells were either left untreated or incubated with 10 ng/ml IFN-γ for 30 minutes as indicated. Lysates were analyzed as in (B), using an antibody to STAT1 for supershift experiments as indicated. Positions of STAT1 and STAT1-DNA complexes are marked with arrows.
Figure 4
Figure 4
Comparative analysis for STAT3 activity in colon carcinoma tissue and low passage colon cell lines derived from the respective tumors. (A) Histologic representation (methylene blue staining) of sections from tumors that were analyzed for STAT3 activity in (B) and gave rise to the COGA cell lines studied in (C). (B) EMSA of samples from tumors that gave rise to the COGA cell lines studied in (C). The SIE m67 STAT binding element was used as a probe; supershift experiments were performed by employing an antibody to STAT3 as indicated. Arrows mark the positions of the respective complexes. Only portions of the biopsies were processed for sample preparation that had previously been confirmed as cancerous by histologic examination of flanking sections (compare A). (C) EMSA analysis of cell lines originating from the tumors assayed in (A) and (B). Cells were either left quiescent or stimulated with 10 ng/ml IL-6 before lysis and treatment as in (B).
Figure 5
Figure 5
Expression and activation of heterologous STAT3 variants in HT-29 cells and effects of STAT3 activity on cell proliferation. (A) Western blot analysis of tyrosine phosphorylation (top) and expression (bottom) of retrovirally introduced STAT3 variants in HT-29 cells. Cells were either left untreated or incubated with 10 ng/ml IL-6 for 30 minutes as indicated, lysed, and probed with antibody to phosphorylated STAT3 (top) or STAT3 (bottom), respectively. (B) Proliferation of HT-29 derivatives expressing constitutively active or dominant-negative STAT3 variants. Samples of 5 x 10⁴ cells of each cell line were seeded into individual wells of six-well cell culture plates in a volume of 2 ml. Medium was changed every 2 days. Where indicated, IL-6 was present in the medium at a concentration of 20 ng/ml throughout the entire cultivation period. After 3, 6, and 9 days, aliquots were counted using a Neubauer chamber and cell numbers were extrapolated to the total culture volume. Results are from four equivalent experiments. (C) Proliferation of COGA 1 cells in dependence of IL-6 stimulation. The experiment was performed as described under (A) with the following variations: individual cultures were started at a cell number of 2 x 10⁴; cell numbers were determined after cultivation for 3 and 6 days. Results are from four independent experiments.
Figure 6
Figure 6
Determination of STAT3 acticity in HT-29 xenograft tumors. (A) Left: Test by EMSA for the formation of specific complexes on the SIE m67 STAT recognition element. Extracts of HT-29-derived tumors from nude mice (1–4) were incubated with the radiolabelled probe and analyzed by native PAGE and autoradiography. Right: Identification of STAT3 in the DNA-protein complex from tumor “1” by incubation with a specific anti-STAT3 antibody as indicated. Positions of STAT3-containing complexes and the antibody-dependent supershifted complex are marked by arrows. (B) Histologic examination of an HT-29-derived xenograft tumor for STAT3 activity. Sections from a representative tumor induced by injection of HT-29 cells into nude mice were stained with hematoxilin/eosin (top) or immunoreacted with an antibody specific for STAT3 phosphorylated at tyrosine 705 (bottom). Typical sites of crypt-like structures and tumor tissues with substantial nuclear concentration of activated STAT3 are indicated by arrows.
Figure 7
Figure 7
Influence of a dominant-negative STAT3 variant on the growth of HT-29 xenograft tumors. (A) Size of explanted tumors from nude mice injected with HT-29 cells (white bar) and HT-29 cells stably expressing dominant-negative STAT3 (grey bar). Closed and open circles represent the measured sizes of the individual HT-29 and HT-29 STAT3 d.n. tumors, respectively. Bars with standard errors represent average tumor sizes; P was determined by Student's t test. (B) (Inducible) STAT3 tyrosine phosphorylation in cells before implantation into nude mice (left) and on development of xenograft tumors after 21 days (right). Cells were optionally incubated with 10 ng/ml IL-6 for 30 minutes as indicated. After cell or tumor tissue lysis, Western blot analysis was performed with antibody to phosphorylated STAT3 (top) or STAT3 (bottom), respectively. (C) Immunohistologic detection of tyrosine-phosphorylated STAT3 in sections from HT-29 xenograft tumors (left) and HT-29 STAT3 d.n. tumors (right).

Similar articles

Cited by

References

    1. Declan Fleming RY. Colorectal cancer screening and follow-up. Surg Oncol. 1998;7:125–137. - PubMed
    1. Oving IM, Clevers HC. Molecular causes of colon cancer. Eur J Clin Invest. 2002;32:448–457. - PubMed
    1. Grady WM, Markowitz SD. Genetic and epigenetic alterations in colon cancer. Annu Rev Genomics Hum Genet. 2002;3:101–128. - PubMed
    1. Ma AH, Xia L, Littman SJ, Swinler S, Lader G, Polinkovsky A, Olechnowicz J, Kasturi L, Lutterbaugh J, Modrich P, et al. Somatic mutation of hPMS2 as a possible cause of sporadic human colon cancer with microsatellite instability. Oncogene. 2000;19:2249–2256. - PubMed
    1. Duval A, Hamelin R. Genetic instability in human mismatch repair deficient cancers. Ann Genet. 2002;45:71–75. - PubMed

Publication types

MeSH terms

LinkOut - more resources