

Temporally regulated neural crest transcription factors distinguish neuroectodermal tumors of varying malignancy and differentiation
- PMID: 16036108
- PMCID: PMC1501286
- DOI: 10.1593/neo.04637
Temporally regulated neural crest transcription factors distinguish neuroectodermal tumors of varying malignancy and differentiation
Abstract
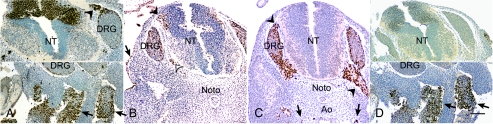
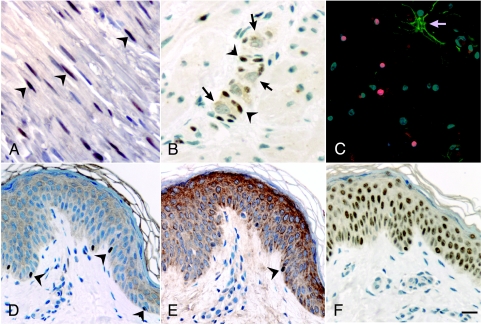
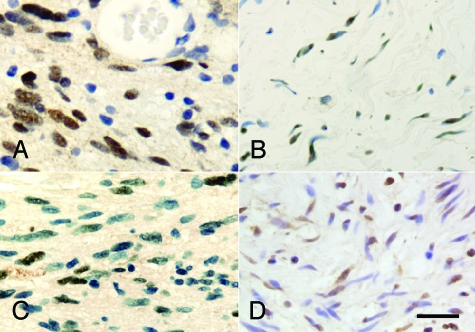
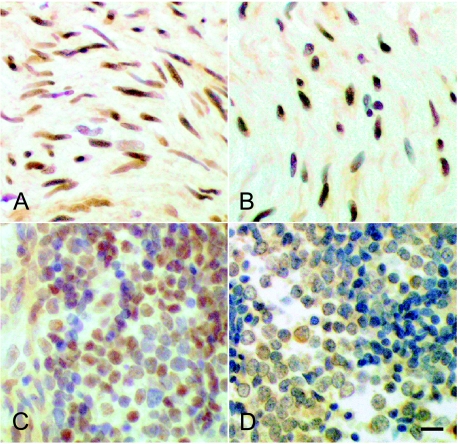
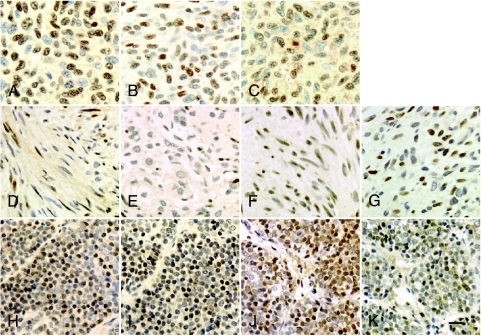
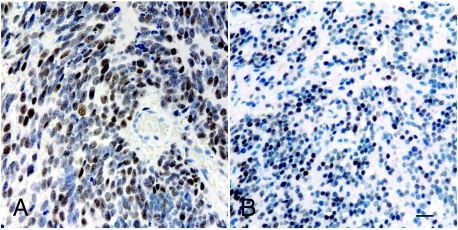
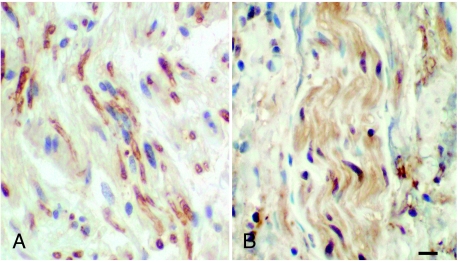
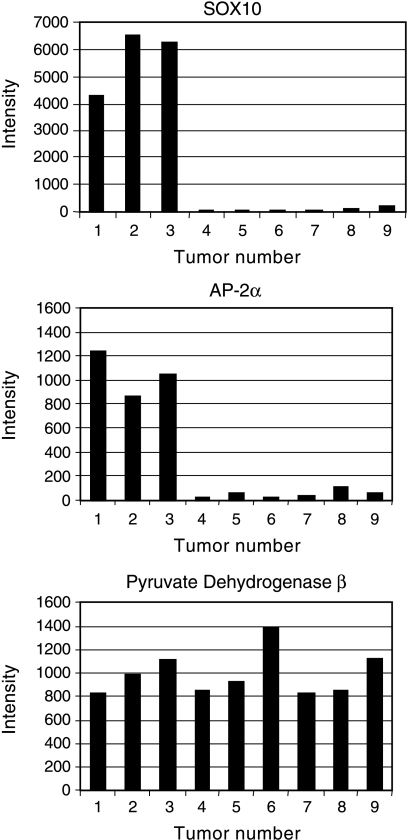
Neuroectodermal tumor cells, like neural crest (NC) cells, are pluripotent, proliferative, and migratory. We tested the hypothesis that genetic programs essential to NC development are activated in neuroectodermal tumors. We examined the expression of transcription factors PAX3, PAX7, AP-2alpha, and SOX10 in human embryos and neuroectodermal tumors: neurofibroma, schwannoma, neuroblastoma, malignant nerve sheath tumor, melanoma, medulloblastoma, supratentorial primitive neuroectodermal tumor, and Ewing's sarcoma. We also examined the expression of P0, ERBB3, and STX, targets of SOX10, AP-2alpha, and PAX3, respectively. PAX3, AP-2alpha, and SOX10 were expressed sequentially in human NC development, whereas PAX7 was restricted to mesoderm. Tumors expressed PAX3, AP-2alpha, SOX10, and PAX7 in specific combinations. SOX10 and AP-2alpha were expressed in relatively differentiated neoplasms. The early NC marker, PAX3, and its homologue, PAX7, were detected in poorly differentiated tumors and tumors with malignant potential. Expression of NC transcription factors and target genes correlated. Transcription factors essential to NC development are thus present in neuroectodermal tumors. Correlation of specific NC transcription factors with phenotype, and with expression of specific downstream genes, provides evidence that these transcription factors actively influence gene expression and tumor behavior. These findings suggest that PAX3, PAX7, AP-2alpha, and SOX10 are potential markers of prognosis and targets for therapeutic intervention.
Figures
Similar articles
-
HDAC1 and HDAC2 control the specification of neural crest cells into peripheral glia.J Neurosci. 2014 Apr 23;34(17):6112-22. doi: 10.1523/JNEUROSCI.5212-13.2014. J Neurosci. 2014. PMID: 24760871 Free PMC article.
-
Complementation of melanocyte development in SOX10 mutant neural crest using lineage-directed gene transfer.Dev Dyn. 2004 Jan;229(1):54-62. doi: 10.1002/dvdy.10468. Dev Dyn. 2004. PMID: 14699577
-
Predominant expression of alternative PAX3 and PAX7 forms in myogenic and neural tumor cell lines.Cancer Res. 1999 Nov 1;59(21):5443-8. Cancer Res. 1999. PMID: 10554014
-
Aberrant PAX3 and PAX7 expression. A link to the metastatic potential of embryonal rhabdomyosarcoma and cutaneous malignant melanoma?Histol Histopathol. 2003 Apr;18(2):529-39. doi: 10.14670/HH-18.529. Histol Histopathol. 2003. PMID: 12647804 Review.
-
How Neural Crest Transcription Factors Contribute to Melanoma Heterogeneity, Cellular Plasticity, and Treatment Resistance.Int J Mol Sci. 2021 May 28;22(11):5761. doi: 10.3390/ijms22115761. Int J Mol Sci. 2021. PMID: 34071193 Free PMC article. Review.
Cited by
-
Robotic and standard surgical intervention as adjunct therapies for retroperitoneal ganglioneuroma resection: a case report.BMC Surg. 2021 Mar 19;21(1):143. doi: 10.1186/s12893-021-01146-x. BMC Surg. 2021. PMID: 33740932 Free PMC article.
-
Pax3 stimulates p53 ubiquitination and degradation independent of transcription.PLoS One. 2011;6(12):e29379. doi: 10.1371/journal.pone.0029379. Epub 2011 Dec 28. PLoS One. 2011. PMID: 22216266 Free PMC article.
-
Medulloblastoma: therapy and biologic considerations.Curr Neurol Neurosci Rep. 2006 May;6(3):200-6. doi: 10.1007/s11910-006-0006-y. Curr Neurol Neurosci Rep. 2006. PMID: 16635428 Review.
-
PAX3 expression patterns in ocular surface melanocytes.Sci Rep. 2025 Apr 11;15(1):12472. doi: 10.1038/s41598-025-90318-3. Sci Rep. 2025. PMID: 40216818 Free PMC article.
-
Expression of SOX9 and SOX10 in central neuroepithelial tumor.J Neurooncol. 2006 Nov;80(2):151-5. doi: 10.1007/s11060-006-9180-7. Epub 2006 Jun 22. J Neurooncol. 2006. PMID: 16791471
References
-
- Tassabehji M, Read AP, Newton VE, Harris R, Balling R, Gruss P, Strachan T. Waardenburg's syndrome patients have mutations in the human homologue of the Pax-3 paired box gene. Nature. 1992;355(6361):635–636. - PubMed
-
- Schorle H, Meier P, Buchert M, Jaenisch R, Mitchell PJ. Transcription factor AP-2 is essential for cranial closure and craniofacial development. Nature. 1996;381(6579):235–238. - PubMed
-
- Pingault V, Bondurand N, Kuhlbrodt K, Goerich DE, Prehu MO, Puliti A, Herbarth B, Hermans-Borgmeyer I, Legius E, Matthijs G, et al. SOX10 mutations in patients with Waardenburg-Hirschsprung disease. Nat Genet. 1998;18(2):171–173. - PubMed
-
- Southard-Smith EM, Kos L, Pavan WJ. Sox10 mutation disrupts neural crest development in Dom Hirschsprung mouse model. Nat Genet. 1998;18(1):60–64. - PubMed
Publication types
MeSH terms
Substances
LinkOut - more resources
Full Text Sources
Research Materials