. 2005 Aug 2;102(31):11106-11.
doi: 10.1073/pnas.0504323102. Epub 2005 Jul 21.

Alterations in the alpha2 isoform of Na,K-ATPase associated with familial hemiplegic migraine type 2

Affiliations

Alterations in the alpha2 isoform of Na,K-ATPase associated with familial hemiplegic migraine type 2

Laura Segall et al. Proc Natl Acad Sci U S A. .

Abstract

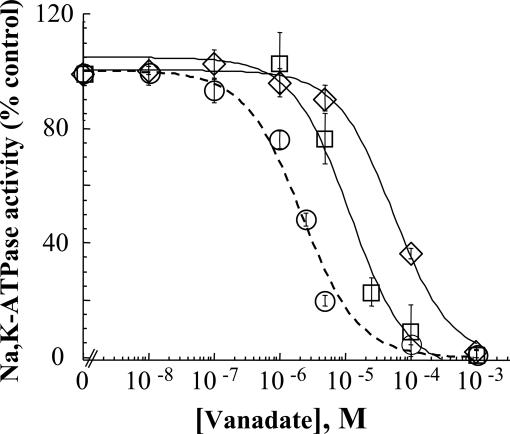
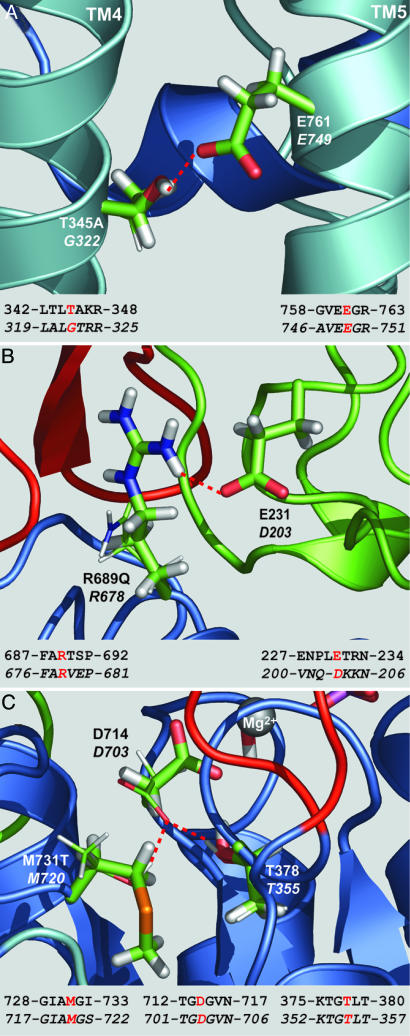
A number of missense mutations in the Na,K-ATPase alpha2 catalytic subunit have been identified in familial hemiplegic migraine with aura. Two alleles (L764P and W887R) showed loss-of-function, whereas a third (T345A) is fully functional but with altered Na,K-ATPase kinetics. This study describes two additional mutants, R689Q and M731T, originally identified by Vanmolkot et al. [Vanmolkot, K. R., et al. (2003) Ann. Neurol. 54, 360-366], which we show here to also be functional and kinetically altered. Both mutants have reduced catalytic turnover and increased apparent affinity for extracellular K(+). For both R689Q and M731T, sensitivity to vanadate inhibition is decreased, suggesting that the steady-state E(1) <==> E(2) poise of the enzyme is shifted toward E(1). Whereas the K'(ATP) is not affected by the R689Q replacement, the M731T mutant has an increase in apparent affinity for ATP. Analysis of the structural changes effected by T345A, R689Q, and M731T mutations, based on homologous replacements in the known crystal structure of the sarcoplasmic reticulum Ca-ATPase, provides insights into the molecular bases for the kinetic alterations. It is suggested that the disease phenotype is the consequence of lowered molecular activity of the alpha2 pump isoform due to either decreased K(+) affinity (T345A) or catalytic turnover (R689Q and M731T), thus causing a delay in extracellular K(+) clearance and/or altered localized Ca(2+) handling/signaling secondary to reduced activity in colocalized Na(+)/Ca(2+) exchange.


Figures

Scheme 1.
Scheme 1.
Abbreviated Na,K-ATPase model. ATPL represents ATP binding with low affinity. EXT, extracellular; CYT, cytoplasmic.
Fig. 1.
Fig. 1.
Comparison of α2*- and mutant α2*-transfected HeLa cell growth rates and α2* protein expression. Growth curves for WT- and mutant-transfected HeLa cells were generated as described in Materials and Methods. Inset shows Western blot analysis for α2* protein expression for samples with the units [(μmol/mg per min) x 10-12] of Na,K-ATPase activity shown above each lane. Symbols and lines are as follows: ○, α2*; □, R689Q; ⋄, M731T.
Fig. 2.
Fig. 2.
Vanadate sensitivity of α2*, R689Q, and M731T. ATP hydrolysis was determined in medium containing 100 mM NaCl, 10 mM KCl, and 1 mM ATP and with varying vanadate concentrations as described in Materials and Methods. Data presented as percent of the control Na,K-ATPase measured in the absence of vanadate were fitted to a one-compartment model by using a nonlinear least-square analysis of a general logistic function (23). Values shown are the mean ± SD of triplicate determinations from a representative experiment. I50 vanadate values obtained from replicate experiments with two clones were 2.12 ± 0.17, 13.17 ± 3.43, and 57.83 ± 11.61 μM for α2*, R689Q and M731T, respectively. Symbols are as in Fig. 1. For R689Q and M731T, P < 0.05, compared with α2.
Fig. 3.
Fig. 3.
ATP, Na+, and K+ activation of Na,K-ATPase activity. Data shown are means ± SD of the number of experiments shown in parentheses, each carried out in triplicate. Symbols are as in Fig. 1. (A) ATP hydrolysis was assayed in the presence of 100 mM NaCl/10 mM KCl/4 mM MgSO4 and varying ATP concentrations as described in Materials and Methods and normalized to 100% Vmax. Data were fitted to a one-site Michaelis-Menten model. K′ATP values were 158.3 ± 19.5 (6), 142.8 ± 21.3 (4), and 67.31 ± 15.1 μM (3) for α2*, R689Q, and M731T, respectively. P < 0.0001 for M731T compared with α2*. (B) Na+ activation of Na,K-ATPase was determined as described in Materials and Methods, maintaining a constant KCl concentration of 10 mM. The data were fitted to a three-site cooperative model and normalized to 100% Vmax. K0.5(Na) values were 5.43 ± 0.88 (10), 5.77 ± 1.43 (7), and 6.48 ± 1.46 mM (5) for α2*, R689Q, and M731T, respectively. P > 0.2 for R689Q and M731T. (C) K+ activation of Na,K-ATPase was determined as described in Materials and Methods, maintaining a constant NaCl concentration of 100 mM. Data were fitted to a two-site cooperative model and normalized to 100% vmax. K0.5(K) values were 1.69 ± 0.21 (6), 0.34 ± 0.01 (3), and 0.56 ± 0.06 mM (3) for α2*, R689Q, and M731T respectively. P < 0.0001 for R689Q and M731T, compared with α2*.
Fig. 4.
Fig. 4.
K+ activation of (86Rb+)K+ influx. Assays were carried out as described in Materials and Methods with cells equilibrated and assayed in the presence of 20 mM Na+, in medium containing varying concentrations of KCl as indicated. Data were fitted to a two-site cooperative model and normalized to 100% Vmax. K0.5(KEXT) values were 0.48 ± 0.11 (3), 0.25 ± 0.03 (3), and 0.27 ± 0.02 mM (3) for α2*, R689Q, and M731T respectively. P < 0.05 for R689Q and M731T, compared with α2*.
Fig. 5.
Fig. 5.
Structural analysis of the mutants by comparison with SERCA. Color convention is in agreement with Sweadner and Donnet (19): A domain in green, P domain in blue, N domain in red, and TMs in pale blue. Residues of the WT enzyme are in stick representation. The mutated residues and the WT residues that change conformation upon mutation are displayed as thin sticks. Na,K-ATPase and SERCA corresponding residues of interest are labeled, the latter in italics. Below each panel, the local alignment is shown with the displayed residues in red and SERCA sequence in italics. (A) T345A mutant (SERCA E2 state, PDB ID code 1IWO, ref. 11). (B) R689Q mutant (SERCA E2-Pi.2Ca state, PDB ID code 1WPG, ref. 12). (C) M731T mutant (SERCA E1-ATP.2Ca state, PDB ID code 1VFP, ref. 13). Red dashed lines indicate hydrogen bonds. Figure designed with pymol 0.93(DeLano Scientific, South San Francisco, CA).

References

    1. Kaplan, J. H. (2002) Annu. Rev. Biochem. 71, 511-535. - PubMed
    1. Jorgensen, P. L., Hakansson, K. O. H. & Karlish, S. J. D. (2003) Ann. Rev. Physiol. 65, 817-849. - PubMed
    1. Sweadner, K. J. (1989) Biochim. Biophys. Acta 988, 185-220. - PubMed
    1. Moseley, A. E., Dean, W. L. & Delamere, N. A. (1996) Invest. Ophthalmol. Visual Sci. 37, 1502-1508. - PubMed
    1. Orlowski, J. & Lingrel, J. B. (1988) J. Biol. Chem. 263, 10436-10442. - PubMed

Publication types

MeSH terms