Comparative Study
. 2006 Feb;27(2):129-43.
doi: 10.1002/hbm.20171.

Generic head models for atlas-based EEG source analysis

Affiliations
Comparative Study

Generic head models for atlas-based EEG source analysis

Felix Darvas et al. Hum Brain Mapp. 2006 Feb.

Abstract

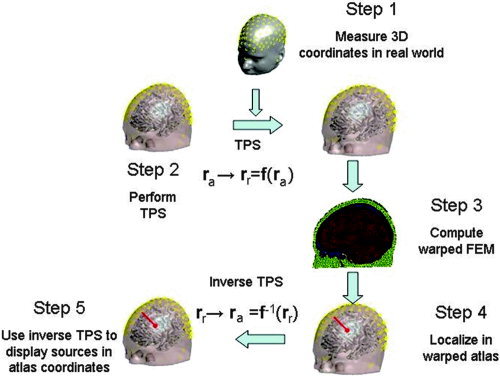
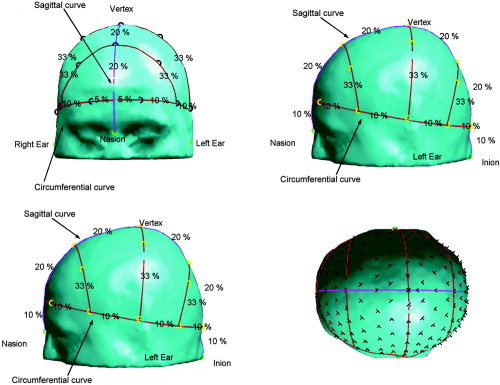
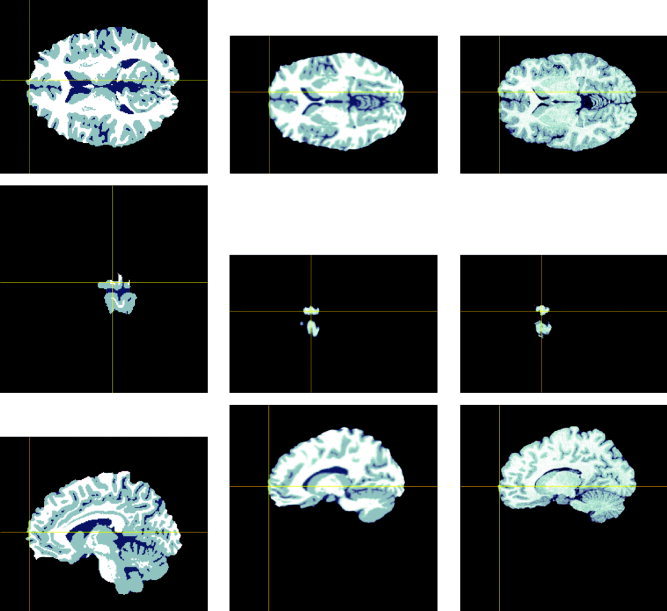
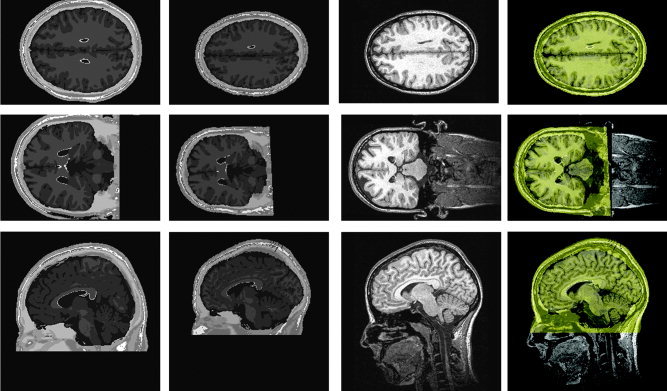
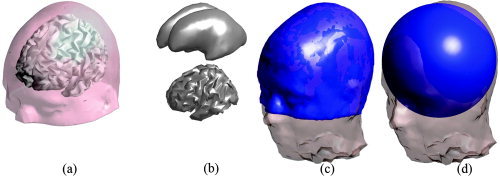
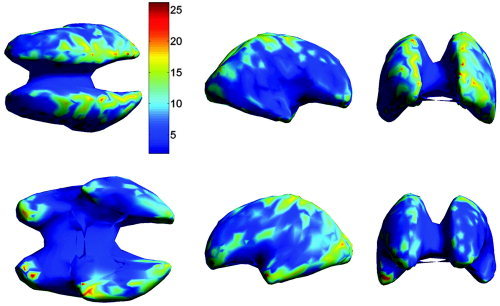
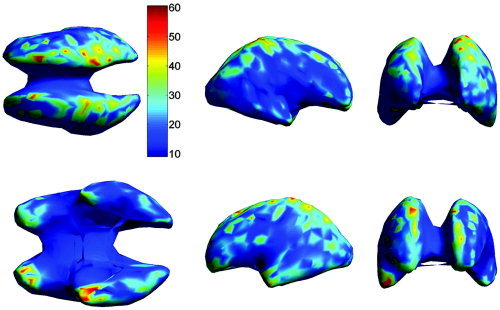
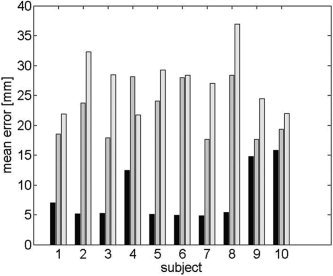
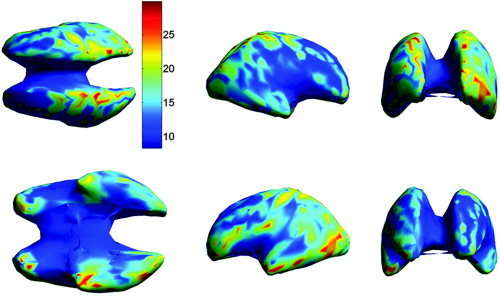
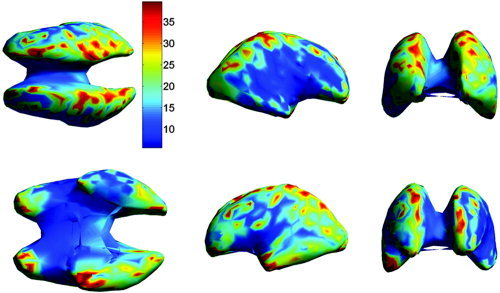
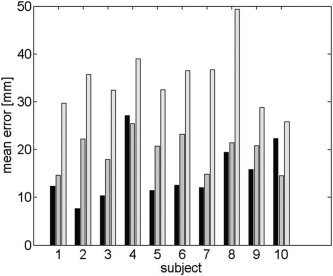
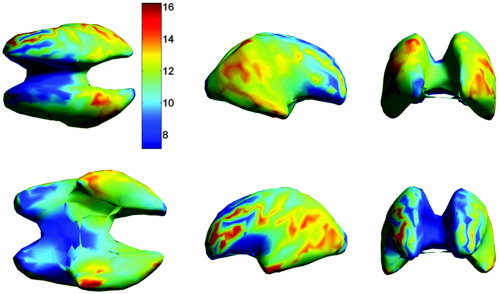
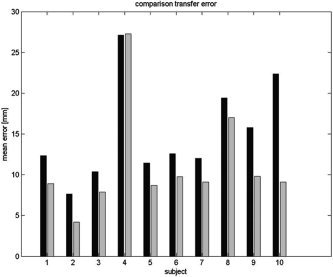
We describe a method for using a generic head model, in the form of an anatomical atlas, to produce EEG source localizations. The atlas is fitted to the subject by a nonrigid warp using a set of surface landmarks. The warped atlas is used to compute a finite element model (FEM) of the forward mapping or lead-fields between neural current generators and the EEG electrodes. These lead-fields are used to localize current sources from the subject's EEG data and the sources are then mapped back to the anatomical atlas. This approach provides a mechanism for comparing source localizations across subjects in an atlas-based coordinate system, which can be used in the large fraction of EEG studies in which MR images are not available. The Montreal brain atlas was used as the reference anatomical atlas and 10 individual MR volumes were used to evaluate the method. The atlas was fitted to each subject's head by a thin-plate-spline (TPS) warp. The spatial locations of a generic 155-electrode configuration were used to constrain the warp. For the purposes of evaluation, dipolar sources were placed on the inner cortical surface in the atlas geometry and transferred to each subject's brain space using a polynomial warp. The parameters of the warp were computed using an intensity-based matching of the atlas and subject brains, thus ensuring that the sources were placed at approximately the same anatomical location in each case. Data were simulated in the subject geometry and a dipole fit was performed on these data using an FEM of the TPS warped atlas. The source positions found in the warped atlas were transferred back to the original atlas and compared to the original position. Sources were simulated at 972 locations evenly distributed over the inner cortical surface of the atlas. The mean error over all 10 subjects was 8.1 mm in the subject space and 15.2 mm in the atlas space. In comparison, using an affine transformation of the electrodes into atlas space and an FEM model generated from the atlas produced mean errors of 22.3 mm in subject space and 19.6 mm in atlas space. With a standard three-shell spherical model the errors were 27.2 mm in the subject space and 34.7 mm when mapped to atlas space.


Figures

Figure 1
Figure 1
The generic head modeling approach: we compute an atlas‐to‐subject warp using the thin‐plate spline (TPS) in which the locations of the electrodes, in conjunction with nasion, inion, and preauricular points, serve as homologous landmarks. The coordinates of an FEM mesh, computed from the segmented atlas, are then transformed into the subject space using the TPS parameters. The warped FEM mesh is used to solve the forward EEG problem in subject coordinates and is also used as part of dipole localization procedure. Finally, the estimated dipole source locations are warped back into the atlas coordinate system using the inverse of the TPS transformation.
Figure 2
Figure 2
Generic 19 electrode configuration on the atlas. The circumferential line and the auxiliary lines are marked in red, the coronal line is marked in purple. The electrode positions are represented by black circles and the landmarks by green circles. The intervals in percentage of the line length are displayed between the electrode positions. The 155‐electrode configuration is shown in the lower right corner. The electrode positions are indicated by black crosses.
Figure 3
Figure 3
The first column shows three orthogonal views of the original atlas brain. The crosshair shows a source location. The second column shows the atlas brain with source after application of the polynomial warp. The third column shows the three corresponding orthogonal views of the subject MR. Note that the anatomical location of the source in the warped atlas corresponds approximately to that in the subject MR.
Figure 4
Figure 4
The first column shows the unwarped atlas brain. The MR image block has been padded to match the size of the real MR image (256 × 256 × 170 voxels). The second column shows the three views of the atlas brain after application of the TPS warp. The third column shows the corresponding slices of the original MR image. The fourth column shows the overlay of the warped Montreal atlas (yellow) onto the original geometry.
Figure 5
Figure 5
a: The Montreal atlas with the inner cortical surface as source space. b: The inner cortical surface (bottom) and a smoothed version of the same surface (top). c: The atlas geometry (blue), after applying the surface based warp, overlaid on the corresponding real geometry. d: The fitted sphere (blue) overlaid on the real geometry.
Figure 6
Figure 6
The mean localization error (in mm) in the individual subject space, averaged over all subjects, as a function of cortical location. Each dipole location was estimated using an FEM forward model based on the TPS warped atlas, with the warping parameters computed using extracranial landmarks. For display purposes, in this and subsequent images, the location errors are mapped onto a smoothed representation of the inner cortical surface of the atlas. The views shown in the upper row are from left to right: dorsal, right, and rostral. The lower row shows the ventral, left, and caudal view.
Figure 7
Figure 7
The mean localization error (in mm) in subject coordinates as in Figure 6, but with dipole locations computed using the affine transformed individual electrode positions in atlas space. The views shown in the upper row are from left to right: top, right, and front. The lower row shows the bottom, left, and back view.
Figure 8
Figure 8
The mean localization error in the individual subject space for each of 10 individual subjects for the warped atlas‐based FEM (black), the affine transformation (gray), and spherical models (light gray). The averages were computed for each subject across the entire cortical surface.
Figure 9
Figure 9
The mean localization error in the atlas space, averaged over all subjects, as a function of cortical location. Each dipole location was computed in subject coordinates using an FEM forward model computed from the TPS warped atlas. Dipole locations were then mapped back to atlas space using a second TPS transformation as described in Materials and Methods. The views shown in the upper row are from left to right: top, right, and front. The lower row shows the bottom, left, and back view.
Figure 10
Figure 10
The mean localization error in atlas coordinates as in Figure 9, but with dipole locations computed using the affine transformation of electrodes into the atlas space. The views shown in the upper row are from left to right: top, right, and front. The lower row shows the bottom, left, and back view.
Figure 11
Figure 11
The mean localization error in atlas space for each of 10 individual subjects for the warped atlas based FEM (black), the affine transformation (gray), and spherical models (light gray). The averages were computed for each subject across the entire cortex after the sources were mapped back into atlas space using the TPS.
Figure 12
Figure 12
The transfer error in the atlas space, averaged over all subjects, as a function of cortical location. These errors show the combined effect of mapping from atlas to subject space using the intensity‐based polynomial warp followed by the inverse TPS transformation from subject to atlas as described in Materials and Methods. The views shown in the upper row are from left to right: top, right, and front. The lower row shows the bottom, left, and back view.
Figure 13
Figure 13
The transfer error (gray) in atlas space averaged across the entire cortex for each subject and compared to the overall localization error for the warped atlas based FEM (black).

References

    1. Awada K, Jackson D, Williams J, Wilton D, Baumann S, Papanicolaiu A (1997): Computational aspects of finite element modeling in EEG source localization. IEEE Trans Biomed Eng 44: 736–752. - PubMed
    1. Awada K, Jackson D, Baumann S, Williams J, Fink P, Prasky B (1998): Effect of conductivity uncertainties and modeling errors on EEG source localization using a 2‐D model. IEEE Trans Biomed Eng 45: 1135–1145. - PubMed
    1. Baillet S, Garnero L (1997): A Bayesian approach to introducing anatomo‐functional priors in the EEG/MEG inverse problem. IEEE Trans Biomed Eng 44: 374–385. - PubMed
    1. Baillet S, Mosher JC, Leahy RM (2004): Electromagnetic imaging using BrainStorm In: IEEE International Symposium on Biomedical Imaging: Macro to Nano, 2004. New York: IEEE; p 652–655.
    1. Bookstein F (1996): Landmark methods for forms without landmarks: morphometrics of group differences in outline shape. Med Image Anal 1: 225–243. - PubMed

Publication types

MeSH terms