. 2005 Aug;138(4):2097-110.
doi: 10.1104/pp.105.060673. Epub 2005 Jul 22.

Autophagic nutrient recycling in Arabidopsis directed by the ATG8 and ATG12 conjugation pathways

Affiliations

Autophagic nutrient recycling in Arabidopsis directed by the ATG8 and ATG12 conjugation pathways

Allison R Thompson et al. Plant Physiol. 2005 Aug.

Abstract

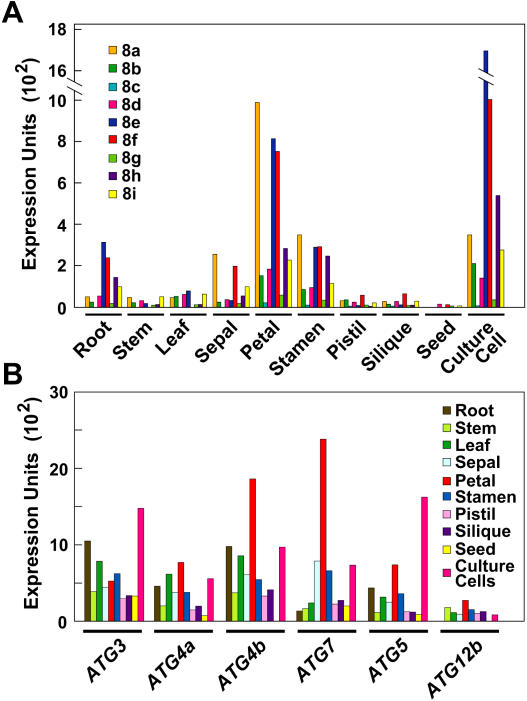
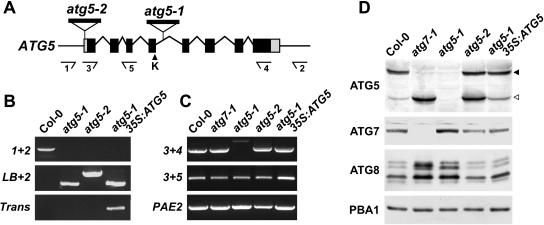
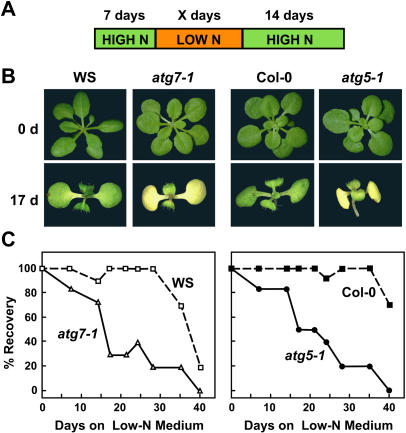
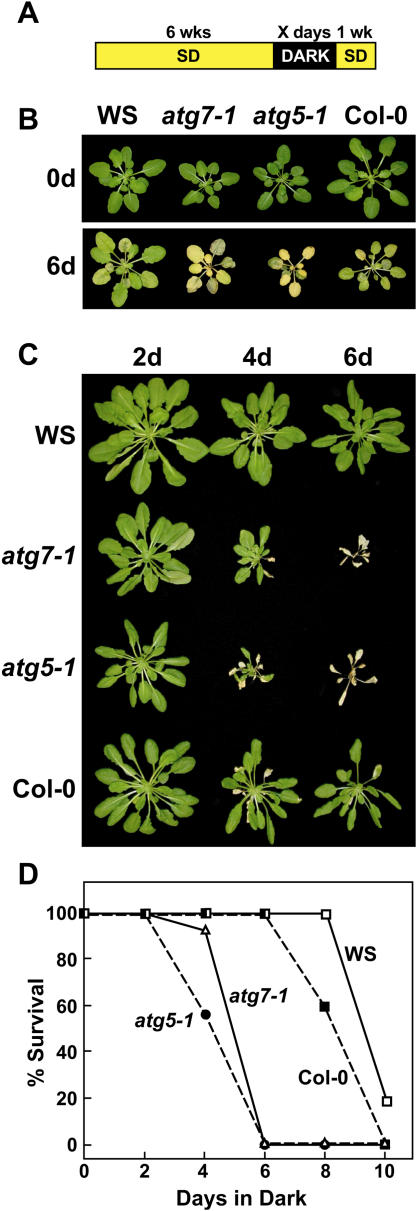
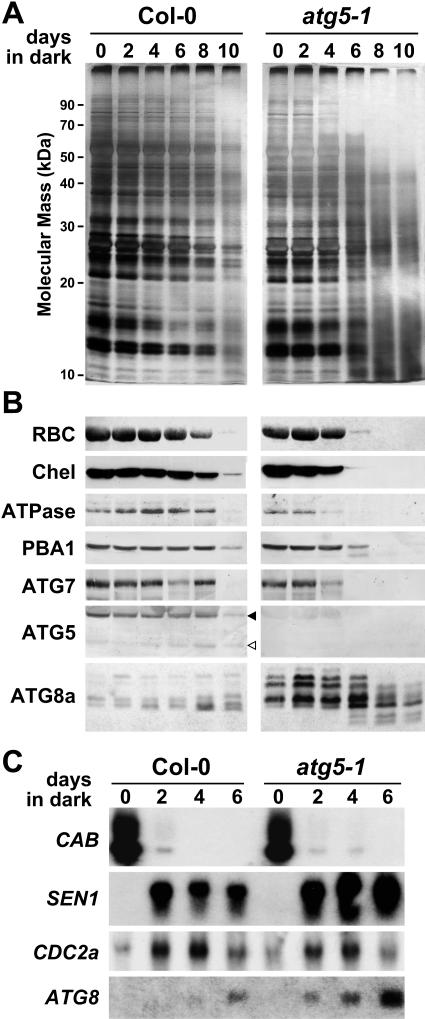
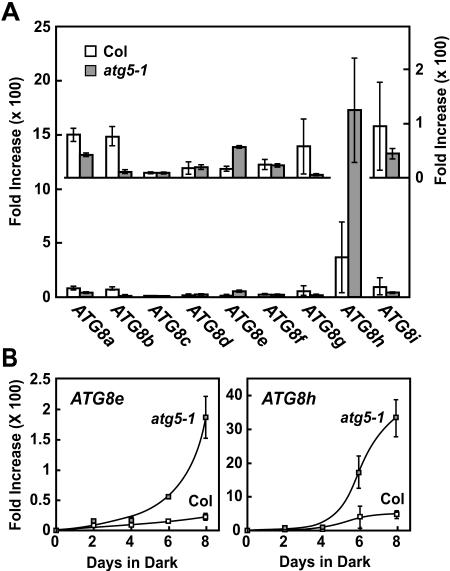
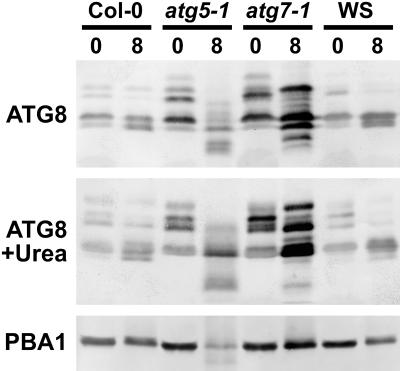
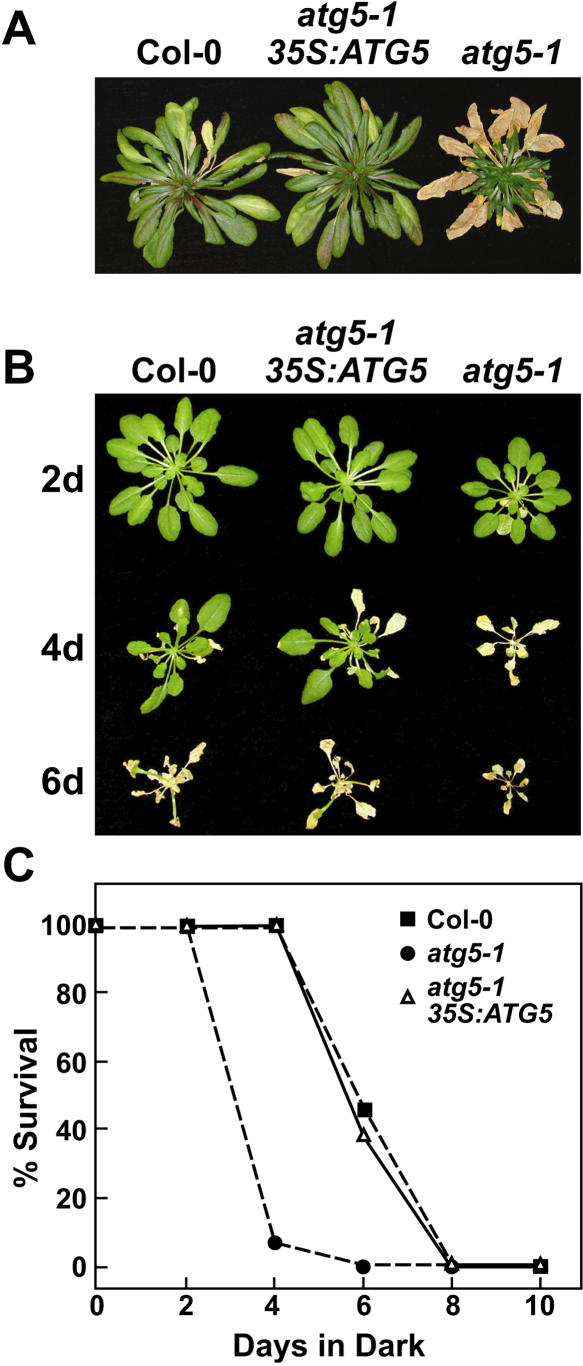
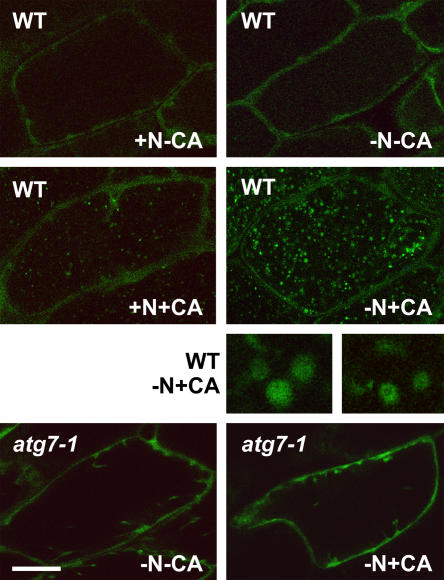
Autophagy is an important mechanism for nonselective intracellular breakdown whereby cytosol and organelles are encapsulated in vesicles, which are then engulfed and digested by lytic vacuoles/lysosomes. In yeast, this encapsulation employs a set of autophagy (ATG) proteins that direct the conjugation of two ubiquitin-like protein tags, ATG8 and ATG12, to phosphatidylethanolamine and the ATG5 protein, respectively. Using an Arabidopsis (Arabidopsis thaliana) atg7 mutant unable to ligate either tag, we previously showed that the ATG8/12 conjugation system is important for survival under nitrogen-limiting growth conditions. By reverse-genetic analyses of the single Arabidopsis gene encoding ATG5, we show here that the subpathway that forms the ATG12-ATG5 conjugate also has an essential role in plant nutrient recycling. Similar to plants missing ATG7, those missing ATG5 display early senescence and are hypersensitive to either nitrogen or carbon starvation, which is accompanied by a more rapid loss of organellar and cytoplasmic proteins. Multiple ATG8 isoforms could be detected immunologically in seedling extracts. Their abundance was substantially elevated in both the atg5 and atg7 mutants, caused in part by an increase in abundance of several ATG8 mRNAs. Using a green fluorescent protein-ATG8a fusion in combination with concanamycin A, we also detected the accumulation of autophagic bodies inside the vacuole. This accumulation was substantially enhanced by starvation but blocked in the atg7 background. The use of this fusion in conjunction with atg mutants now provides an important marker to track autophagic vesicles in planta.


Figures

Figure 1.
Figure 1.
Expression levels of Arabidopsis ATG genes. Microarray expression levels of the nine-member ATG8 gene family (A) and other ATG genes (B) in various Arabidopsis tissues. Expression levels are graphed as normalized expression units × 102.
Figure 2.
Figure 2.
Sequence comparison of the ATG5 protein among eukaryotes. Amino acid sequence comparison of Arabidopsis (At) ATG5 (At5g17290) with the rice (Os; AP004084), yeast (S. cerevisiae, Sc; Kametaka et al., 1996), Drosophila (Dm; AAL39741), and human (Hs) orthologs (Hammond et al., 1998). Identical and similar amino acids are shown in reverse type and gray boxes, respectively. Dots denote gaps. Numbers at the end indicate the amino acid length of each protein. The asterisk marks the Lys (K128 in At) that provides the attachment site for ATG12. The arrowhead locates the T-DNA insertion site in the atg5-1 mutant.
Figure 3.
Figure 3.
Description of the Arabidopsis atg5-1 and atg5-2 mutants. A, Diagram of the Arabidopsis ATG5 gene. Lines indicate introns. Boxes indicate exons, with coding regions in black and the 5′ and 3′ UTRs in gray. The arrowhead locates the Lys (K-128) that provides the attachment site for ATG12. The locations of the T-DNA in the atg5-1 and atg5-2 mutants are shown. Arrows locate the priming sites used in B and C. B, Genomic PCR analysis of the atg5-1 and atg5-2 mutants. Genomic DNA isolated from wild-type Col-0, atg5-1, atg5-2, and atg5-1 complemented with 35S:ATG5 was subjected to PCR using either the number 1 and number 2 primer pairs (1 + 2), the number 2 primer with the LB of the T-DNA (LB + 2), or primers specific to the 35S:ATG5 transgene (Trans). C, RT-PCR analysis of the atg5-1 and atg5-2 mutants. Total RNA isolated from wild-type Col-0, atg7-1, atg5-1, atg5-2, and atg5-1 complemented with 35S:ATG5 was subjected to RT-PCR using either the number 3 and number 4 primer pair (3 + 4) or the number 3 and number 5 primer pair (3 + 5). A primer pair specific for PAE2 was used as an internal control. D, Immunoblot analysis of the atg5-1 and atg5-2 mutants. Crude protein extracts of wild-type Col-0, atg7-1, atg5-1, atg5-2, and atg5-1 complemented with 35S:ATG5 prepared from 10-d-old seedlings were subjected to SDS-PAGE and immunoblot analysis with anti-ATG7, anti-ATG5, and anti-ATG8 antibodies. Equal protein loads were confirmed by immunoblot analysis with anti-PBA1 antibodies. Black and white arrowheads identify the presumed ATG12-ATG5 conjugate (50 kD) and free ATG5 (40 kD), respectively.
Figure 4.
Figure 4.
Enhanced sensitivity of atg5-1 plants to N-deficient conditions. Plant lines include atg7-1 and atg5-1 and their respective wild-types WS and Col-0. A, Diagram of treatment. One-week-old seedlings were sown on N-rich agar medium and transferred to N-deficient agar medium for various lengths of time before transfer back to N-rich medium, all under a long-day photoperiod. B, Representative seedlings after 0 d and 17 d on N-deficient medium. C, The percentage of plants that survived growth for various days on N-deficient medium as determined by resumption of growth when transferred to N-rich medium. Each point represents the average of 10 seedlings.
Figure 5.
Figure 5.
Enhanced sensitivity of atg7-1 and atg5-1 plants to C-limiting conditions induced by extended darkness. Plant lines include atg7-1 and atg5-1 and their respective wild types WS and Col-0. A, Diagram of treatment. Six-week-old plants were grown under a short-day photoperiod, transferred to darkness for various lengths of time, and then transferred back to the short-day photoperiod. B, Plants immediately before or after a 6-d dark treatment. C, Plants after 1-week recovery from 2-, 4-, and 6-d dark treatments. D, Percentage of plants that survived this regime as determined by resumption of growth is plotted versus days in the dark. Each point represents the average of 10 seedlings.
Figure 6.
Figure 6.
Protein and RNA analyses of atg5-1 plants exposed to C-limiting conditions induced by extended darkness. Tissue was collected from wild-type Col-0 and atg5-1 seedlings just after removing the plants from the indicated lengths of extended darkness (see Fig. 5B). A and B, SDS-PAGE analysis of total protein from an equal amount of tissue by fresh weight. A, Gels silver stained for total protein. B, Gels subjected to immunoblot analysis with antibodies against the large subunit of Rubisco, magnesium-protoporphyrin chelatase (Chel), the F1 subunit of mitochondrial ATPase (ATPase), β-subunit A of the 26S proteasome (PBA1), ATG7, ATG5, and ATG8. Black and white arrowheads identify the presumed ATG12-ATG5 conjugate (50 kD) and free ATG5 (40 kD), respectively. C, RNA gel-blot analysis of equal amounts of total RNA using probes for CAB, SEN1, CDC2a, and ATG8a. Equal loading of total RNA was confirmed by staining for rRNA with methylene blue (data not shown).
Figure 7.
Figure 7.
Relative abundance of individual ATG8 mRNAs in Col-0 and atg5-1 plants exposed to C-limiting conditions induced by extended darkness. Relative abundance was obtained by real-time RT-PCR using the CT method and expressed as the average of triplicate technical repeats with se. All values are graphed as a fold increase in mRNA abundance relative to that at day 0 and were normalized against the abundance of histone H2A mRNA, used here as an internal control. A, Relative increases in mRNA abundance of each ATG8 transcript after 6 d of dark treatment as compared to abundance before treatment. Inset shows an expanded scale for the ATG8a to ATG8g and ATG8i transcripts. B, mRNA abundance for ATG8e and ATG8h over the course of an 8-d dark treatment relative to that before treatment.
Figure 8.
Figure 8.
Differential accumulation of ATG8 proteins under C-limiting growth conditions induced by extended darkness. Tissue was collected from wild types (Col-0 and WS), atg5-1, and atg7-1 immediately before or after 8 d in extended dark. ATG8 proteins were detected by immunoblot analysis with anti-ATG8 antibodies following SDS-PAGE with (bottom) or without (top) 6 m urea in the separating gel. Total protein from equivalent amounts of tissue fresh weight was used in each case. Intensities of PBA1 as detected with anti-PBA1 antibodies reflect the levels of total protein.
Figure 9.
Figure 9.
Complementation of the atg5-1 mutation with ATG5. Plant lines include wild type (Col-0), atg5-1, and atg5-1 complemented with a 35S:ATG5 transgene. A, Plants grown on soil for 3 months under a short-day photoperiod. B, Six-week-old plants grown under a short-day photoperiod, transferred to darkness for 2 to 6 d, and then transferred back to the short-day photoperiod. Images were taken after a 1-week recovery from the dark treatment. C, Percentage of plants that survived extended darkness as determined by resumption of growth is plotted versus days in the dark. Each point represents the average of 10 seedlings.
Figure 10.
Figure 10.
Use of a GFP-ATG8 fusion to detect possible autophagic vesicles inside the vacuole. Eight-day-old wild-type Col-0 and atg7-1 seedlings expressing a GFP-ATG8a fusion were grown in N-rich liquid medium for 6 d, transferred to N-rich (+N) or N-deficient (−N) liquid media for approximately 1.5 d, and then incubated for an additional 12 to 16 h with 0.5 μm concanamycin A (+CA) or an equal volume of dimethyl sulfoxide (−CA). Hypocotyls were visualized by fluorescence confocal microscopy of GFP. Size bars for images are equal to approximately 50 μm. Five-times magnifications of possible autophagic bodies in the vacuole of wild-type plants are included.

Similar articles

Cited by

References

    1. Brouquisse R, Gaudillere JP, Raymond P (1998) Induction of a carbon-starvation-related proteolysis in whole maize plants submitted to light/dark cycles and to extended darkness. Plant Physiol 117: 1281–1291 - PMC - PubMed
    1. Buchanan-Wollaston V, Page T, Harrison E, Breeze E, Lim PO, Nam HG, Lin JF, Wu SH, Swidzinski J, Ishizaki K, et al (2005) Comparative transcriptome analysis reveals significant differences in gene expression and signaling pathways between developmental and dark/starvation-induced senescence in Arabidopsis. Plant J 42: 567–585 - PubMed
    1. Clough SJ, Bent AF (1998) Floral dip: a simplified method for Agrobacterium-mediated transformation of Arabidopsis thaliana. Plant J 16: 735–743 - PubMed
    1. Contento AL, Kim SJ, Bassham DC (2004) Transcriptome profiling of the response of Arabidopsis suspension culture cells to Suc starvation. Plant Physiol 135: 2330–2347 - PMC - PubMed
    1. Cutler SR, Ehrhardt DW, Griffitts JS, Somerville CR (2000) Random GFP::cDNA fusions enable visualization of subcellular structures in cells of Arabidopsis at a high frequency. Proc Natl Acad Sci USA 97: 3718–3723 - PMC - PubMed

Publication types

Associated data