

Noise and functional protein dynamics
- PMID: 16040739
- PMCID: PMC1366769
- DOI: 10.1529/biophysj.105.060178
Noise and functional protein dynamics
Abstract
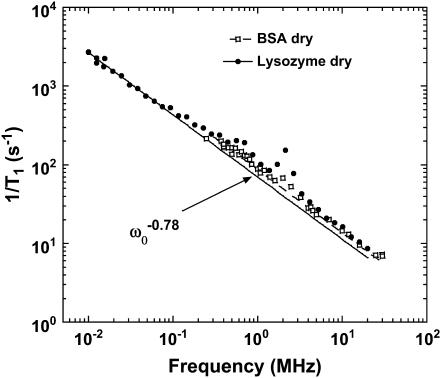
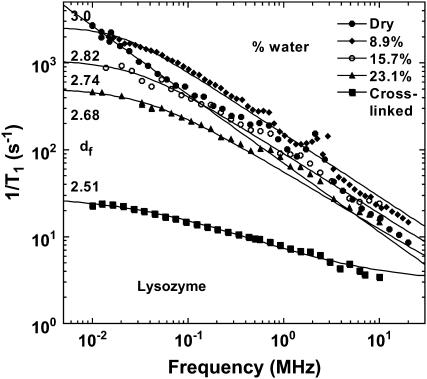
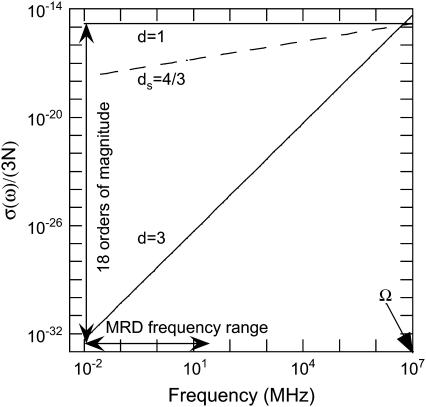
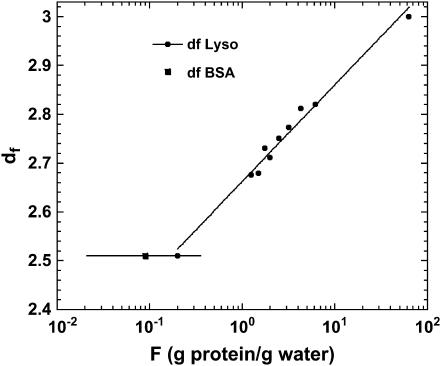
The magnetic field dependence of the proton-spin-lattice relaxation rate in rotationally immobilized proteins shows that the one-dimensional character of the protein primary structure causes a dramatic increase in the population of low-frequency motions from 10 kHz to 20 MHz. As a consequence, the probability and rate at which functionally critical conformational states are thermally sampled in a protein are dramatically increased as well, when compared with a three-dimensional lattice structure. Studies of protein dynamics often focus on time periods far shorter than those associated with catalytic function, but we show here that the magnetic field dependence of the proton nuclear spin-lattice relaxation rate in rotationally immobilized proteins reports unambiguously the structural fluctuations in the frequency range from 10 kHz to 20 MHz. This relaxation rate decreases with increasing Larmor frequency according to a power law that derives from the distribution of dynamical states, the localization of the structural disturbances, and the spatial distribution of hydrogen atoms in the structure. The robust theoretical foundation for the spin-relaxation process, loosely characterized as a direct spin-phonon coupling, shows that the disturbances propagate in a space of reduced dimensionality, essentially along the stiff connections of the polypeptide chain. The reduced dimensionality traps the disturbance and changes the efficiency for energy redistribution in the protein and the processes that drive nuclear spin relaxation. We also show that the Larmor frequency dependence of the protein-proton-spin-lattice relaxation rate constant is related to the frequency dependence of force constants and mean-square displacement commonly observed or calculated for proteins. We believe that these approaches give additional physical insight into the character of the extremely low-frequency protein dynamics.
Figures
Similar articles
-
Water molecule contributions to proton spin-lattice relaxation in rotationally immobilized proteins.J Magn Reson. 2009 Jul;199(1):68-74. doi: 10.1016/j.jmr.2009.04.001. Epub 2009 Apr 8. J Magn Reson. 2009. PMID: 19394883 Free PMC article.
-
Water and backbone dynamics in a hydrated protein.Biophys J. 2010 Jan 6;98(1):138-46. doi: 10.1016/j.bpj.2009.09.054. Biophys J. 2010. PMID: 20085726 Free PMC article.
-
Paramagnetic relaxation of protons in rotationally immobilized proteins.J Chem Phys. 2006 Apr 7;124(13):134910. doi: 10.1063/1.2183311. J Chem Phys. 2006. PMID: 16613480
-
Self-diffusion studies by intra- and inter-molecular spin-lattice relaxometry using field-cycling: Liquids, plastic crystals, porous media, and polymer segments.Prog Nucl Magn Reson Spectrosc. 2017 Aug;101:18-50. doi: 10.1016/j.pnmrs.2017.04.001. Epub 2017 Apr 9. Prog Nucl Magn Reson Spectrosc. 2017. PMID: 28844220 Review.
-
Multiscale nuclear magnetic relaxation dispersion of complex liquids in bulk and confinement.Prog Nucl Magn Reson Spectrosc. 2018 Feb;104:12-55. doi: 10.1016/j.pnmrs.2017.11.001. Epub 2017 Nov 10. Prog Nucl Magn Reson Spectrosc. 2018. PMID: 29405980 Review.
Cited by
-
Fractal symmetry of protein interior: what have we learned?Cell Mol Life Sci. 2011 Aug;68(16):2711-37. doi: 10.1007/s00018-011-0722-6. Epub 2011 May 26. Cell Mol Life Sci. 2011. PMID: 21614471 Free PMC article. Review.
-
Dimensionality of diffusive exploration at the protein interface in solution.J Phys Chem B. 2009 Oct 8;113(40):13347-56. doi: 10.1021/jp9048082. J Phys Chem B. 2009. PMID: 19754137 Free PMC article.
-
Water molecule contributions to proton spin-lattice relaxation in rotationally immobilized proteins.J Magn Reson. 2009 Jul;199(1):68-74. doi: 10.1016/j.jmr.2009.04.001. Epub 2009 Apr 8. J Magn Reson. 2009. PMID: 19394883 Free PMC article.
-
Water and backbone dynamics in a hydrated protein.Biophys J. 2010 Jan 6;98(1):138-46. doi: 10.1016/j.bpj.2009.09.054. Biophys J. 2010. PMID: 20085726 Free PMC article.
References
Publication types
MeSH terms
Substances
LinkOut - more resources
Full Text Sources
Medical
Research Materials
