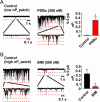
Constitutively active L-type Ca2+ channels
- PMID: 16040810
- PMCID: PMC1180225
- DOI: 10.1073/pnas.0500360102
Constitutively active L-type Ca2+ channels
Abstract
Ca(2+) influx through L-type Ca(2+) channels (LTCCs) influences numerous physiological processes ranging from contraction in muscle and memory in neurons to gene expression in many cell types. However, the spatiotemporal organization of functional LTCCs has been nearly impossible to investigate because of methodological limitations. Here, we examined LTCC function with high temporal and spatial resolution using evanescent field fluorescence microscopy. Surprisingly, we found that LTCCs operated in functionally organized clusters, not necessarily as individual proteins. Furthermore, LTCC function in these clusters does not appear to be controlled by simple stochastic gating but instead by a PKC-dependent switch mechanism. This work suggests that resting intracellular free calcium concentration in arterial myocytes is predominantly controlled by this process in combination with rare voltage-dependent openings of individual LTCCs. We propose that Ca(2+) influx via persistent LTCCs may be an important mechanism regulating steady-state local and global Ca(2+) signals.
Figures


Similar articles
-
Elevated Ca2+ sparklet activity during acute hyperglycemia and diabetes in cerebral arterial smooth muscle cells.Am J Physiol Cell Physiol. 2010 Feb;298(2):C211-20. doi: 10.1152/ajpcell.00267.2009. Epub 2009 Oct 21. Am J Physiol Cell Physiol. 2010. PMID: 19846755 Free PMC article.
-
Inhibition of voltage-gated L-type calcium channels by labedipinedilol-A involves protein kinase C in rat cerebrovascular smooth muscle cells.Vascul Pharmacol. 2009 Aug-Sep;51(2-3):65-71. doi: 10.1016/j.vph.2009.03.001. Epub 2009 Mar 17. Vascul Pharmacol. 2009. PMID: 19298869
-
Calcium sparklets in arterial smooth muscle.Clin Exp Pharmacol Physiol. 2008 Sep;35(9):1121-6. doi: 10.1111/j.1440-1681.2007.04867.x. Epub 2008 Jan 21. Clin Exp Pharmacol Physiol. 2008. PMID: 18215181 Free PMC article. Review.
-
Downregulation of L-type Ca2+ channel in rat mesenteric arteries leads to loss of smooth muscle contractile phenotype and inward hypertrophic remodeling.Am J Physiol Heart Circ Physiol. 2014 May;306(9):H1287-301. doi: 10.1152/ajpheart.00503.2013. Epub 2014 Feb 21. Am J Physiol Heart Circ Physiol. 2014. PMID: 24561864
-
Different subcellular populations of L-type Ca2+ channels exhibit unique regulation and functional roles in cardiomyocytes.J Mol Cell Cardiol. 2012 Feb;52(2):376-87. doi: 10.1016/j.yjmcc.2011.08.014. Epub 2011 Aug 23. J Mol Cell Cardiol. 2012. PMID: 21888911 Free PMC article. Review.
Cited by
-
Peering into the Molecular Machinery for Regulation of Cav1.2 Channel Clusters.Circ Res. 2022 Dec 2;131(12):1034-1036. doi: 10.1161/CIRCRESAHA.122.322131. Epub 2022 Dec 1. Circ Res. 2022. PMID: 36454852 Free PMC article. No abstract available.
-
Mechanisms underlying heterogeneous Ca2+ sparklet activity in arterial smooth muscle.J Gen Physiol. 2006 Jun;127(6):611-22. doi: 10.1085/jgp.200609519. Epub 2006 May 15. J Gen Physiol. 2006. PMID: 16702354 Free PMC article.
-
Ca2+ -induced Ca2+ release through localized Ca2+ uncaging in smooth muscle.J Gen Physiol. 2006 Mar;127(3):225-35. doi: 10.1085/jgp.200509422. J Gen Physiol. 2006. PMID: 16505145 Free PMC article.
-
Local regulation of arterial L-type calcium channels by reactive oxygen species.Circ Res. 2010 Oct 15;107(8):1002-10. doi: 10.1161/CIRCRESAHA.110.217018. Epub 2010 Aug 26. Circ Res. 2010. PMID: 20798361 Free PMC article.
-
SMAKing Ca2+ sparks in arterial myocytes.J Physiol. 2007 Oct 1;584(Pt 1):1. doi: 10.1113/jphysiol.2007.143529. Epub 2007 Aug 23. J Physiol. 2007. PMID: 17717006 Free PMC article. No abstract available.
References
-
- Fish, R. D., Sperti, G., Colucci, W. S. & Clapham, D. E. (1988) Circ. Res. 62, 1049-1054. - PubMed
-
- Deisseroth, K., Heist, E. K. & Tsien, R. W. (1998) Nature 392, 198-202. - PubMed
-
- Dolmetsch, R. E., Pajvani, U., Fife, K., Spotts, J. M. & Greenberg, M. E. (2001) Science 294, 333-339. - PubMed
-
- Nishiyama, M., Hoshino, A., Tsai, L., Henley, J. R., Goshima, Y., Tessier-Lavigne, M., Poo, M. M. & Hong, K. (2003) Nature 423, 990-995. - PubMed
Publication types
MeSH terms
Substances
Grants and funding
LinkOut - more resources
Full Text Sources
Other Literature Sources
Miscellaneous

