Comparative Study
. 2005 Aug;73(8):4895-904.
doi: 10.1128/IAI.73.8.4895-4904.2005.

Comparison of Helicobacter pylori virulence gene expression in vitro and in the Rhesus macaque

Affiliations
Comparative Study

Comparison of Helicobacter pylori virulence gene expression in vitro and in the Rhesus macaque

Jenni K Boonjakuakul et al. Infect Immun. 2005 Aug.

Abstract

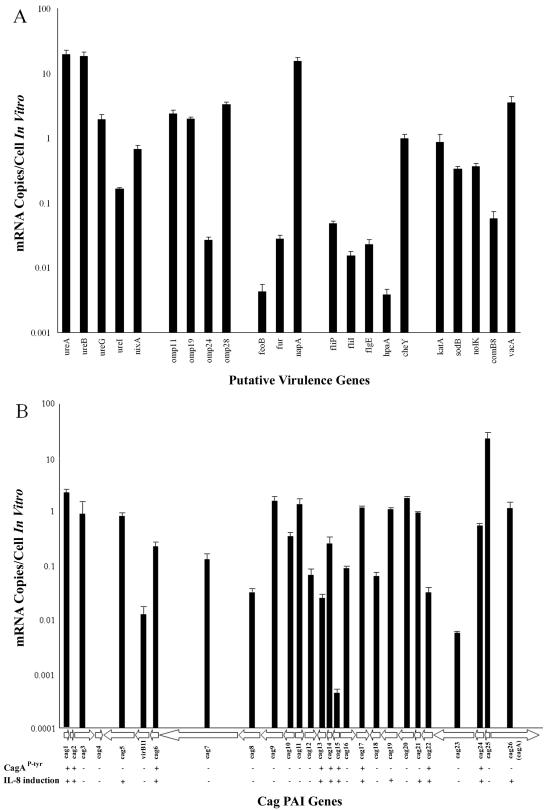
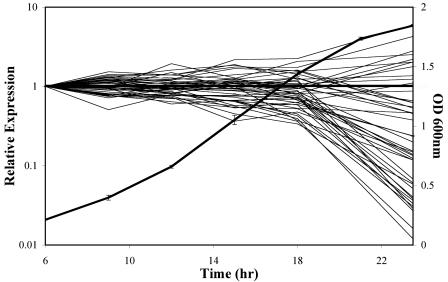
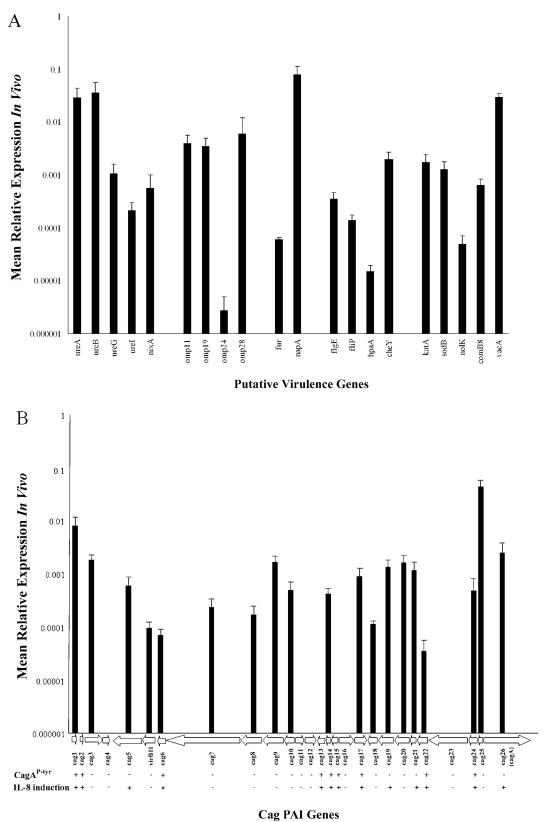
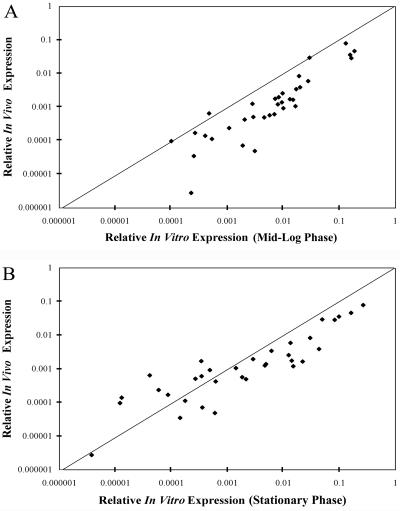
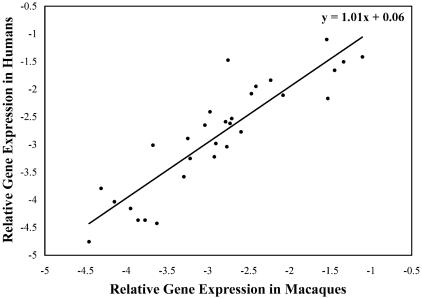
We used a quantitative real-time reverse transcriptase PCR assay to measure the transcript abundance of 46 known and putative Helicobacter pylori virulence genes, including 24 genes on the Cag pathogenicity island. The expression profile of H. pylori cells grown in vitro was also compared to expression in vivo after experimental infection of rhesus macaques. Transcript abundance in vitro (mid-log phase) ranged from about 0.004 (feoB and hpaA) to 20 (ureAB, napA, and cag25) copies/cell. Expression of most genes was repressed during the transition from logarithmic- to stationary-phase growth, but several well-characterized H. pylori virulence genes (katA, napA, vacA, and cagA) were induced. Comparison of results in the rhesus macaque with similar data from humans showed a strong correlation (r = 0.89). The relative in vivo expression in the rhesus monkey was highly correlated with in vitro expression during mid-log (r = 0.89)- and stationary (r = 0.88)-phase growth. Transcript abundance was on average three- to fourfold reduced in vivo compared to in vitro during mid-log phase. However, when compared to stationary phase, increased expression in vivo was observed for 6 of 7 genes on a contiguous portion of the pathogenicity island, several of which are thought to encode the H. pylori type IV structural pilus and its accessory proteins. These results suggest the possibility that some genes encoding the H. pylori type IV structural pilus and accessory proteins may form an operon that is induced during growth in vivo.


Figures

FIG. 1.
FIG. 1.
In vitro expression (mRNA copies/cell) measured during the mid-logarithmic phase of growth (15 h; OD600, 1.0). (A) Putative virulence genes. Genes are grouped according to similar functions (Table 1). (B) Cag pathogenicity island genes. Arrows represent the directions of the open reading frame. Plus and minus signs indicate whether a nonpolar deletion mutant in the respective PAI gene shows the phenotype of IL-8 induction or CagA tyrosine phosphorylation according to published data (20).
FIG. 2.
FIG. 2.
Change in expression relative to time point 1 (6 h; OD600, 0.2) for putative virulence genes and genes on the Cag PAI. Fine lines (y axis, left) represent individual genes whose relative mRNA copies per cell have either increased or decreased at each time point. The bold line (y axis, right) is the growth curve (mean OD600) for H. pylori grown in duplicate liquid cultures. Relative expression levels fluctuate over the growth curve, with the most significant changes seen between 18 h (OD600, 1.4) and 23.5 h (OD600, 1.8), specifically as the growth is exiting logarithmic phase and entering stationary phase. The horizontal bold line drawn at 1.0 (y axis, left) shows expression equivalent to that at time point 1.
FIG. 3.
FIG. 3.
Agarose gel electrophoresis of Rep-PCR of H. pylori input, output, and naturally acquired strains. The output strains are identical to the input strain and can easily be distinguished from other naturally acquired strains. Lane A, H. pylori J166 input strain; lanes B to F, five output strains from experimentally infected rhesus monkeys; lanes G to J, naturally acquired rhesus strains of H. pylori.
FIG. 4.
FIG. 4.
Comparison of quantitative culture results to Ct for 16S rRNA. Each datum point represents a single animal. For rRNA Ct values, RNA was extracted from 6 combined biopsy specimens. For the CFU/g data, 2 biopsy specimens were combined and cultured. The best fit linear trend line is shown, and the Pearson product correlation coefficient was found to be 0.80 (P < 0.005).
FIG. 5.
FIG. 5.
Relative expression in vivo 1 week p.i. normalized to the level of 16S rRNA (16S rRNA = 1.0). (A) Relative expression levels of putative virulence genes, grouped according to similar functions (Table 1). (B) Relative expression of genes on the Cag PAI. Arrows represent the direction of the open reading frame. Plus and minus signs indicate whether a nonpolar deletion mutant in the respective PAI gene shows the phenotype of IL-8 induction or CagA tyrosine phosphorylation according to published data (20). Genes for which no data are shown were not examined.
FIG. 6.
FIG. 6.
Dot plot comparing the relative gene expression between in vivo and in vitro samples. Points above the diagonal line represent genes whose expression is higher in vivo, and points below the line are genes whose expression is higher in vitro. In vivo datum points are the averages of the results from 3 to 5 animals, with each gene analyzed in duplicate. In vitro expression was analyzed for duplicate cultures during mid-log-phase growth (15 h; OD600, 1.0) (A) and stationary-phase growth (23.5 h; OD600, 1.8) (B). The Pearson product correlation coefficients were 0.89 and 0.88 for the data shown in panels A and B, respectively.
FIG. 7.
FIG. 7.
Comparison of the relative in vivo gene expression in rhesus macaques to that found in humans (determined from previously published data) (10). Data report only genes that are in common between the two studies. The time point for the rhesus macaque data was 1 week p.i., and data represent mean gene expression for results from five animals. Relative gene expression data are plotted as log10. The Pearson product correlation coefficient was calculated to be 0.89. The best fit linear trend line and linear equation are shown.

References

    1. Akada, J. K., M. Shirai, H. Takeuchi, M. Tsuda, and T. Nakazawa. 2000. Identification of the urease operon in Helicobacter pylori and its control by mRNA decay in response to pH. Mol. Microbiol. 36:1071-1084. - PubMed
    1. Akopyants, N. S., S. W. Clifton, D. Kersulyte, J. E. Crabtree, B. E. Youree, C. A. Reece, N. O. Bukanov, E. S. Drazek, B. A. Roe, and D. E. Berg. 1998. Analyses of the cag pathogenicity island of Helicobacter pylori. Mol. Microbiol. 28:37-53. - PubMed
    1. Alm, R. A., L. S. Ling, D. T. Moir, B. L. King, E. D. Brown, P. C. Doig, D. R. Smith, B. Noonan, B. C. Guild, B. L. deJonge, G. Carmel, P. J. Tummino, A. Caruso, M. Uria-Nickelsen, D. M. Mills, C. Ives, R. Gibson, D. Merberg, S. D. Mills, Q. Jiang, D. E. Taylor, G. F. Vovis, and T. J. Trust. 1999. Genomic-sequence comparison of two unrelated isolates of the human gastric pathogen Helicobacter pylori. Nature 397:176-180. - PubMed
    1. Aras, R. A., W. Fischer, G. I. Perez-Perez, M. Crosatti, T. Ando, R. Haas, and M. J. Blaser. 2003. Plasticity of repetitive DNA sequences within a bacterial (type IV) secretion system component. J. Exp. Med. 198:1349-1360. - PMC - PubMed
    1. Aspholm-Hurtig, M., G. Dailide, M. Lahmann, A. Kalia, D. Ilver, N. Roche, S. Vikstrom, R. Sjostrom, S. Linden, A. Backstrom, C. Lundberg, A. Arnqvist, J. Mahdavi, U. J. Nilsson, B. Velapatino, R. H. Gilman, M. Gerhard, T. Alarcon, M. Lopez-Brea, T. Nakazawa, J. G. Fox, P. Correa, M. G. Dominguez-Bello, G. I. Perez-Perez, M. J. Blaser, S. Normark, I. Carlstedt, S. Oscarson, S. Teneberg, D. E. Berg, and T. Boren. 2004. Functional adaptation of BabA, the H. pylori ABO blood group antigen binding adhesin. Science 305:519-522. - PubMed

Publication types

LinkOut - more resources