. 2005 Aug;37(8):894-8.
doi: 10.1038/ng1608. Epub 2005 Jul 24.

A stress-sensitive reporter predicts longevity in isogenic populations of Caenorhabditis elegans

Affiliations

A stress-sensitive reporter predicts longevity in isogenic populations of Caenorhabditis elegans

Shane L Rea et al. Nat Genet. 2005 Aug.

Abstract

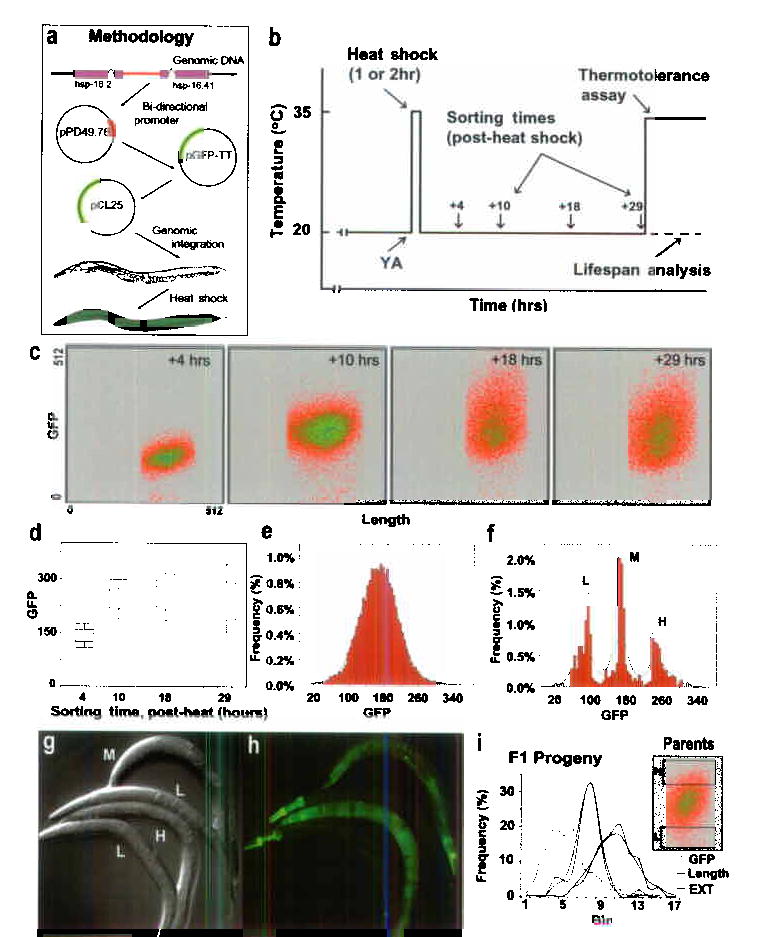
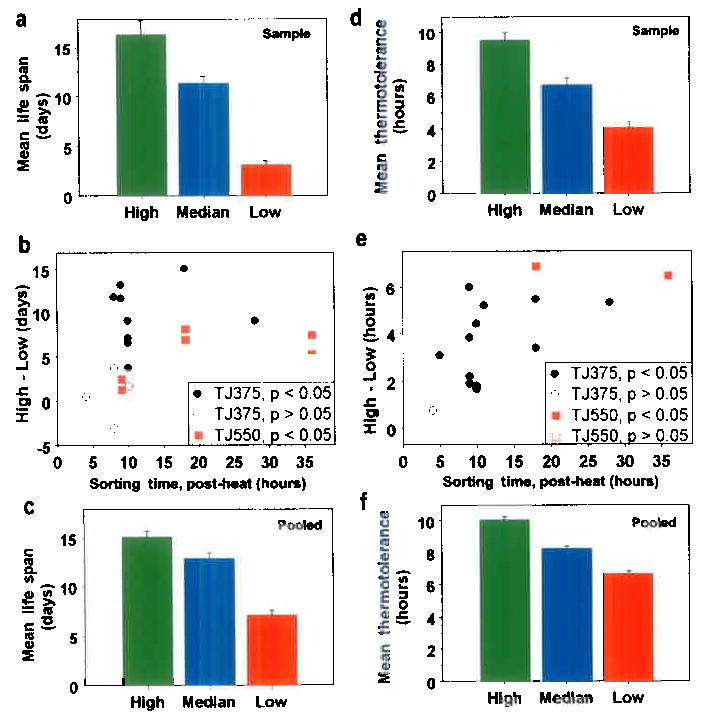
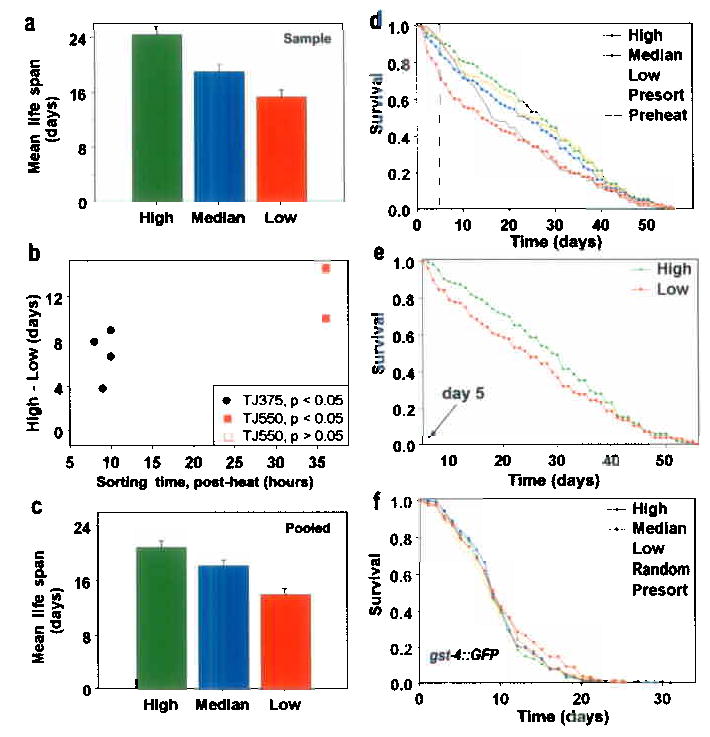
When both genotype and environment are held constant, 'chance' variation in the lifespan of individuals in a population is still quite large. Using isogenic populations of the nematode Caenorhabditis elegans, we show that, on the first day of adult life, chance variation in the level of induction of a green fluorescent protein (GFP) reporter coupled to a promoter from the gene hsp-16.2 predicts as much as a fourfold variation in subsequent survival. The same reporter is also a predictor of ability to withstand a subsequent lethal thermal stress. The level of induction of GFP is not heritable, and GFP expression levels in other reporter constructs are not associated with differences in longevity. HSP-16.2 itself is probably not responsible for the observed differences in survival but instead probably reflects a hidden, heterogeneous, but now quantifiable, physiological state that dictates the ability of an organism to deal with the rigors of living.


Figures

Figure 1
Figure 1
Overview. (a) Outline of experimental design and construction of TJ375. (b) Schematic of hsp-16::GFP induction, sorting, and analysis. (c) Individual fluorescence data from a representative experiment. Increasing density of events is color-coded (red to blue). (d) Box and whisker plots summarizing fluorescence distribution of worm populations at each sort time following the end of the heat shock. (e) Distribution of GFP levels in a typical population 19 hours after induction by a 2 hr 35 °C pulse (Mean ± SD is 168.0 ± 44.9 GFP units); the green line shows a normal distribution with the same mean and SD. (f) Distribution of individuals selected in a sort of low (L), median (M) and high (H) levels of expression. (g, h) Representative worms from each of the three sub-populations in (f). (i) Properties of progeny derived from parents with high or low GFP fluorescence demonstrating that level of GFP-expression is not heritable. Shown are the population distributions for three parameters: worm length (Length, black lines), optical absorption (EXT, blue lines) and green fluorescence (GFP, green lines). There were no significant differences between progeny derived from the original high or low sub-populations for any of the three parameters (t-test, p-values all >0.3).
Figure 2
Figure 2
Survival and thermotolerance of worms previously sorted on differential hsp-16-2::GFP expression following a two-hour heat shock. (a) A representative longevity assessment showing adult life expectancy following heat shock (mean life span and SEM; High: 16.4 ± 1.5 days; Median: 11.3 ± 0.7 days and Low: 3.2 ± 0.4 days, N = 30 and P < .001, for each). (b) The difference between the average longevity of high and low sub-populations for every study is shown as a point. Significant differences in survival are shown as filled symbols, non-significant as open symbols; TJ375 symbols are black and TJ550 are red. (For details see Supplementary Table II). (c) Combined data for all 13 longevity experiments using TJ375 (High: 15.13 ± 0.61 days, N = 530; Median: 12.92 ± 0.56 days, N = 545; Low: 7.13 ± 0.49 days, N = 550). (For TJ550 see Supplementary Table II). (d) Thermotolerance of worms derived from the same populations that were sampled to generate the longevity data in (a), (mean survival at 35 °C and SE; High: 9.5 ± 0.5 hours; Median: 6.7 ± 0.4 hours; Low: 4.0 ± 0.4 hours, N = 31 to 33, and P < .00001, for each comparison). (e) Each point represents the difference in thermotolerance of the high and low sub-populations for each experiment performed. (Symbols as in Fig. 2b.) (f) Combined data for all thermotolerance experiments (High: 10.07 ± 0.20 hours, N = 394; Median: 8.27 ± 0.15 hours, N = 401; Low: 6.68 ± 0.18 hours, N = 404; all P’s < 10−10.
Figure 3
Figure 3
Survival of worms previously sorted on differential HSP-16-2::GFP expression after 1 hour of induction at 35 °C. Sorting and other conditions were as in Fig. 2. (a) Data from a typical longevity analysis shown as per Fig. 2; (mean life span and SE; High: 24.4 ± 1.1 days; Median: 18.7 ± 1.1 days and Low: 15.35 ± 1.0 days, N = 40 and P < .025, for each). (b) The difference between the average longevity of the high and low sub-populations for each of nine experiments is shown by a point as in Fig. 2. (For details see Supplementary Table II.) (c) Combined data for all longevity experiments (mean resistance and SE; High: 20.86 ± 0.93 days; Median: 18.20 ± 0.80 days; Low: 14.03 ± 0.85 days, N = 149–150 for each, P = .03 for High vs Median and P < .001, for others). (d) Survival trajectories of worms used to generate the data in Fig. 3a. (See also Supplementary Tables I and IV). (e) Survival trajectories of High vs Low subpopulations (as in Fig. 3d) plotted from days 5 onward. The curves are significantly different (P < .05). (f) Not all GFP reporter constructs are biomarkers for longevity. Worms expressing the oxidative stress reporter gst-4::GFP were sorted into constitutively High, Intermediate or Low GFP-expressing populations then their survival was assessed. Shown is the combined data (N = 291 total for each subpopulation) from five independent experiments. Controls include an unsorted population (Presort) and a sorted but unselected population (Random). The curves are not significantly different (P all >0.1). (See Supplementary Table I and also Supplementary Fig. 3).

References

    1. Finch, C.E., & Kirkwood, T.B. Chance, Development and Aging, (Oxford University Press, London, 2000).
    1. Kirkwood TB, Finch CE. Ageing: the old worm turns more slowly. Nature. 2002;419:794–5. - PubMed
    1. Finch CE, Tanzi RE. Genetics of Aging. Science. 1997;278:407–411. - PubMed
    1. Johnson TE. Increased life-span of age-1 mutants in Caenorhabditis elegans and lower Gompertz rate of aging. Science. 1990;249:908–12. - PubMed
    1. Johnson TE, et al. Gerontogenes mediate health and longevity in nematodes through increasing resistance to environmental toxins and stressors. Exp Gerontol. 2000;35:687–94. - PubMed

Publication types

MeSH terms

Substances