. 2005 Aug 1;170(3):429-41.
doi: 10.1083/jcb.200409157. Epub 2005 Jul 25.

Reversible intracellular translocation of KRas but not HRas in hippocampal neurons regulated by Ca2+/calmodulin

Affiliations

Reversible intracellular translocation of KRas but not HRas in hippocampal neurons regulated by Ca2+/calmodulin

Marc Fivaz et al. J Cell Biol. .

Abstract

The Ras/MAPK pathway regulates synaptic plasticity and cell survival in neurons of the central nervous system. Here, we show that KRas, but not HRas, acutely translocates from the plasma membrane (PM) to the Golgi complex and early/recycling endosomes in response to neuronal activity. Translocation is reversible and mediated by the polybasic-prenyl membrane targeting motif of KRas. We provide evidence that KRas translocation occurs through sequestration of the polybasic-prenyl motif by Ca2+/calmodulin (Ca2+/CaM) and subsequent release of KRas from the PM, in a process reminiscent of GDP dissociation inhibitor-mediated membrane recycling of Rab and Rho GTPases. KRas translocation was accompanied by partial intracellular redistribution of its activity. We conclude that the polybasic-prenyl motif acts as a Ca2+/CaM-regulated molecular switch that controls PM concentration of KRas and redistributes its activity to internal sites. Our data thus define a novel signaling mechanism that differentially regulates KRas and HRas localization and activity in neurons.


Figures

Figure 1.
Figure 1.
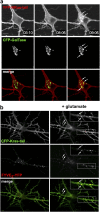
Activity-induced translocation of CFP-KRas-tail and CFP-Rap1-tail to intracellular membranes. Hippocampal neurons (12 d in vitro, DIV) transfected with CFP-KRas-tail (a–c, f and g), CFP-HRas-tail (d and e), or CFP-Rap1a-tail (f and g) were stimulated with 50 μM glutamate. (a) Time-lapse images of CFP-KRas-tail redistributing from the PM to a PN compartment. Time is indicated in min and s. Glutamate was added between the first and second image (see Video 1, available at http://www.jcb.org/cgi/content/full/jcb.200409157/DC1). (b) Example of PM and PN regions of interest selected for the translocation analysis. A PM “mask” was generated for each frame in order to take into account cell movements and cell shape changes (see Materials and methods). (c) Average translocation profile of CFP-KRas-tail (n = 25). Plasma membrane (PM, dark blue) and perinuclear (PN, light blue) fluorescence intensities are plotted over time (see Materials and methods). The black bar indicates application of the stimulus. Note that glutamate-induced CFP-KRas-tail release from the PM precedes accumulation of the probe in PN membranes. (d). Average PM and PN levels of CFP-HRas tail plotted over time (n = 15). (e) Time-lapse images of CFP-HRas-tail before (first image) and after glutamate application. (f) Average translocation profile of CFP-Rap1a-tail to PN membranes (orange trace) compared with that of CFP-KRas-tail (blue trace). (g) Histogram quantifying translocation of CFP-KRas-tail (n = 25, blue bars) and Rap1a (n = 7, orange bars). The translocation index refers to the PN to PM intensity ratio and was measured before (−) and after (+) application of glutamate, when PN fluorescence starts to plateau (see Materials and methods) (*, P < 10−6; **, P < 0.01). Error bars represent the SEM. Bars, 10 μm.
Figure 2.
Figure 2.
Reversibility of the CFP-KRas-tail translocation response. Example of a neuron (DIV 13) coexpressing CFP-KRas-tail and GPI-YFP and stimulated by transient (3 min) application of 25 μM glutamate. Shown are time-lapse ratio images of CFP-KRas-tail over GPI-YFP fluorescence intensity (see Video 2, available at http://www.jcb.org/cgi/content/full/jcb.200409157/DC1). The ratio values are displayed according to a pseudocolor scale (see Materials and methods). CFP-KRas-tail reversibly translocates to PN membranes and peripheral dendritic vesicles (arrows). The time course was quantified by plotting the PM to PN intensity ratio over time (blue trace). As a control, the PM to PN ratio for GPI-YFP is shown in green (PM and PN regions of interest were selected in the cell body). Bars, 10 μm.
Figure 3.
Figure 3.
The Kras-tail probe translocates to Golgi and early endosomal membranes. Hippocampal neurons were cotransfected with YFP-KRas-tail and CFP-GalTase (a) or CFP-KRas-tail and FYVE2-YFP (b) and stimulated with 50 μM glutamate. (a) Time-lapse images showing YFP-KRas-tail translocating to PN structures that largely overlap with the Golgi marker. Glutamate was added between images 1 and 2. (b) Shown are two time points (before and after glutamate addition) indicating a clear redistribution of CFP-KRas-tail to vesicular structures positive for FYVE2-YFP in dendritic processes (see Video 3, available at http://www.jcb.org/cgi/content/full/jcb.200409157/DC1). Arrows point to KRas-tail–positive stuctures that colocalize with CFP-GalTase (a) or FYVE2-YFP (b). Bars, 10 μm.
Figure 4.
Figure 4.
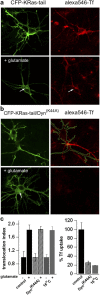
Translocation of the KRas-tail probe is not an endocytic event. Hippocampal neurons expressing CFP-KRas-tail (a), or coexpressing CFP-KRas-tail and a dominant-negative mutant of dynamin-1 (Dyn(K44A)) (b) were fed with 50 μg/ml alexa546-Tf for 20 min and stimulated (or not) with 50 μM glutamate for 5 min at 37°C. Neurons were then processed for immunocytochemistry and stained with an anti-GFP pAb. (a) Glutamate leads to the accumulation of CFP-KRas-tail in a PN area (arrow) that overlaps with endocytosed alexa546-Tf. (b) Glutamate-induced accumulation of CFP-KRas-tail in PN membranes (arrow) is unaffected by overexpression of Dyn(K44A), despite strong inhibition of alexa546-Tf uptake. (c) Quantification of the effect of Dyn(K44A) or temperature on CFP-KRas-tail translocation and alexa546-Tf uptake. Neither Dyn(K44A) nor lowering of the temperature to 16°C (during alexa546-Tf uptake and glutamate stimulation) affected CFP-KRas-tail translocation, whereas both perturbations reduced Tf uptake >75% in the same cells. Error bars represent the SEM. n > 20 for each of these conditions. Bar, 10 μm.
Figure 5.
Figure 5.
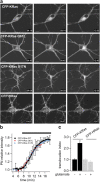
Translocation of full-length KRas is independent of its nucleotide-binding state. Hippocampal neurons transfected with CFP-KRas WT, Q61L, and S17N, or HRas, and stimulated with 50 μM glutamate. (a) Representative examples of glutamate-induced translocation of CFP-KRas WT, Q61L, and S17N. Note that CFP-HRas does not redistribute intracellularly in response to glutamate (glutamate was added between the first and second time point). (b) Average translocation profiles for CFP-KRas WT (n = 18), Q61L (n = 15), and S17N (n = 14). Error bars correspond to the SEM, and were omitted for the CFP-KRas Q61L and S17N traces. (c) Quantification of the translocation responses for WT CFP-KRas (n = 18) and CFP-HRas (n = 15). The translocation index refers to the PN/PM intensity ratio. Error bars represent the SEM. (*, P < 10−6). Bars, 10 μm.
Figure 6.
Figure 6.
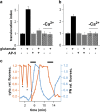
The stimulus-induced translocation of the Kras membrane interaction motif requires Ca2 + signals. (a and b) Glutamate-induced translocations of CFP-KRas-tail and CFP-KRas are inhibited by the NMDA-R antagonist AP-5 or absence of extracellular Ca2+. (a) CFP-KRas-tail. n = 25, 10, and 8 for control, AP-5, and −Ca2+conditions, respectively. (P < 10−5 for the control). (b) CFP-KRas. n = 18, 8, and 9 for control, AP-5, and −Ca2+ conditions, respectively. (P < 10−6 for the control). Error bars represent the SEM. (c) Parallel measurements of glutamate-induced CFP-KRas-tail translocation and Ca2+ increase in a neuron cotransfected with YFP-PKCγ-C2. Ca2+ increases are monitored by translocation of YFP-PKCγ-C2 from the cytoplasm to the PM. The YFP-PKCγ-C2 intensity profile (orange trace) shows variations of fluorescence intensity in a region of interest selected in the cytoplasm. A decrease in YFP-PKCγ-C2 signal is thus indicative of an increase of intracellular Ca2+. CFP-KRas-tail intensity profile (blue trace) was monitored in the PN region. Two consecutive pulses of glutamate were applied (black bars). Note that CFP-KRas-tail translocation events correlate with glutamate-induced Ca2+ increases. The asterisk indicates two spontaneous Ca2+ spikes of short duration and low amplitude that did not result in substantial CFP-KRas-tail translocation.
Figure 7.
Figure 7.
Translocation is inhibited by the CaM antagonist w-7. Hippocampal neurons expressing CFP-KRas-tail were treated on stage with DMSO (control) or 30 μM w-7 for 10 min and then were stimulated with 50 μM glutamate in presence of DMSO or w-7. (a) Translocation profiles of CFP-KRas-tail in DMSO- (n = 7) and w-7–treated (n = 18) neurons. (b) Percent change in CFP-KRas-tail PN intensity in w-7 and control cells, at a time point that corresponds to full translocation for the control condition. Error bars correspond to the SEM. (c) An example of CFP-KRas-tail localization in w-7–treated cells before and ∼15 min after glutamate addition. Bars, 10 μm (*, P < 10−4).
Figure 8.
Figure 8.
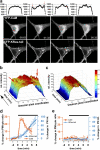
CaM interacts with the COOH-terminal tail of KRas in an activity-dependent manner. Hippocampal neurons cotransfected with YFP-CaM and either CFP-KRas-tail (a, b, and d) or CFP-HRas-tail (c). (a) Addition of glutamate at t = 0 leads to transient recruitment of YFP-CaM to the PM in cells coexpressing CFP-KRas-tail. A line scan across the cell soma (white rectangle) shows transient recruitment of YFP-CaM to the PM (red arrows) and concomitant decrease in intensity in the cytoplasm (red arrowheads). CFP-KRas-tail translocation to PN membranes (white arrows) occurs with slower kinetics. (b) Surface plot displaying the line scan intensity profile of YFP-CaM (in panel a) as a function of time (see Materials and methods). The red arrows indicate translocation to the PM after glutamate addition (t = 0). See Fig. S3 for other examples (available at http://www.jcb.org/cgi/content/full/jcb.200409157/DC1). (c) Line scan surface plot of YFP-CaM in a cell coexpressing CFP-HRas-tail. Glutamate (added at t = 0) does not induce YFP-CaM translocation to the PM. The images from which that surface plot is derived are shown in Fig. S4 together with other examples. (d) Average translocation profile of CaM in KRas-tail–expressing neurons (n = 7). A translocation response was observed in all cells analyzed. The orange trace shows percent change in the PM to cytoplasm intensity ratio as a function of time. The PM and cytoplasm intensity values are derived from the line scan profile and are read at positions corresponding to the “peak” and “valley” (shown in panel a) by the red arrows and arrowheads respectively. (e) A similar analysis for CaM in HRas-tail–expressing neurons shows no sign of translocation (n = 9). None of the cells analyzed in panel e showed any translocation response. The blue traces indicate percent change of intensity in the PN area for KRas-tail (d) and HRas-tail (e). Error bars represent the SEM. Bar, 10 μm.
Figure 9.
Figure 9.
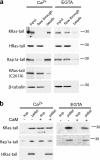
Ca2 + /CaM binds and dissociates CFP-KRas-tail and CFP-Rap1a-tail from membranes. (a) PNS of HeLa cells expressing CFP-KRas-tail, CFP-HRas-tail, CFP-Rap1a-tail, or CFP-KRas-tail (C261A) were incubated with CaM beads in the presence of Ca2+ or EGTA. Input, flow through (unbound material), and beads were analyzed by immunoblotting using an anti-GFP or anti-β-tubulin antibody. (b) A PNS of CFP-KRas-tail–, CFP-Rap1a-tail–, or CFP-HRas-tail–expressing HeLa cells was treated (or not) with purified CaM in the presence of Ca2+ or EGTA and submitted to high speed centrifugation. The supernatant (cytosol) and pellet (membranes) fractions were immunoblotted against GFP. Note that CaM leads to a significant redistribution of a CFP-KRas-tail and CFP-Rap1a-tail from membranes to the cytosol in a Ca2+-dependent manner, but did not extract CFP-HRas-tail from membranes. In each experiment, 100% of the recovered supernatant and pellet fractions were loaded on the gel. Shown are representative examples for each of these experiments, which have been repeated at least three times. The asterisk indicates a soluble protein that is picked up by the anti-GFP antibody and corresponds presumably to a minor fraction of GFP that is not coupled to the prenyl modification.
Figure 10.
Figure 10.
KRas activity redistributes to intracellular membranes upon neuronal stimulation. (a) An example of a hippocampal neuron (DIV 15) cotransfected with YFP-KRas and RBD-CFP (Ras-binding domain of Raf-1 fused to CFP) and stimulated with 50 μM NMDA (added between frame 1 and 2). NMDA induces a rapid recruitment of RBD-CFP from the cytoplasm to the PM (white arrows), followed by translocation of YFP-KRas and concomitant redistribution of RBD-CFP to intracellular membranes (red arrows). Bar, 10 μm. (b) Quantification of RBD-CFP translocation to the PM (blue trace) and intracellular compartments (IC, orange trace) shown in panel a. Recruitment of RBD-CFP to internal sites is delayed and prolonged compared with translocation to the PM. (c) An integrated model for Ras signaling and KRas translocation at the synapse (see last paragraph in the Discussion section).

References

    1. Aderem, A. 1992. The MARCKS brothers: a family of protein kinase C substrates. Cell. 71:713–716. - PubMed
    1. Ames, J.B., R. Ishima, T. Tanaka, J.I. Gordon, L. Stryer, and M. Ikura. 1997. Molecular mechanics of calcium-myristoyl switches. Nature. 389:198–202. - PubMed
    1. Apolloni, A., I.A. Prior, M. Lindsay, R.G. Parton, and J.F. Hancock. 2000. H-ras but not K-ras traffics to the plasma membrane through the exocytic pathway. Mol. Cell. Biol. 20:2475–2487. - PMC - PubMed
    1. Arbuzova, A., J. Wang, D. Murray, J. Jacob, D.S. Cafiso, and S. McLaughlin. 1997. Kinetics of interaction of the myristoylated alanine-rich C kinase substrate, membranes, and calmodulin. J. Biol. Chem. 272:27167–27177. - PubMed
    1. Bijlmakers, M.J., and M. Marsh. 2003. The on-off story of protein palmitoylation. Trends Cell Biol. 13:32–42. - PubMed

Publication types