. 2005 Aug 2;102(31):10870-5.
doi: 10.1073/pnas.0504920102. Epub 2005 Jul 25.

The structure of phospholamban pentamer reveals a channel-like architecture in membranes

Affiliations

The structure of phospholamban pentamer reveals a channel-like architecture in membranes

Kirill Oxenoid et al. Proc Natl Acad Sci U S A. .

Abstract

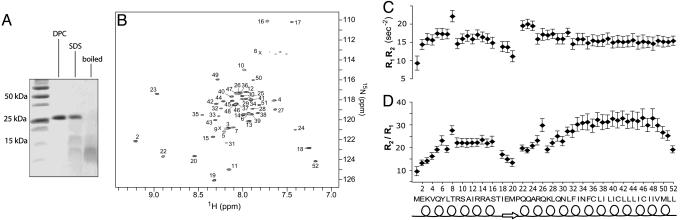
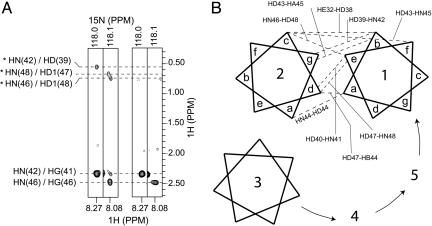
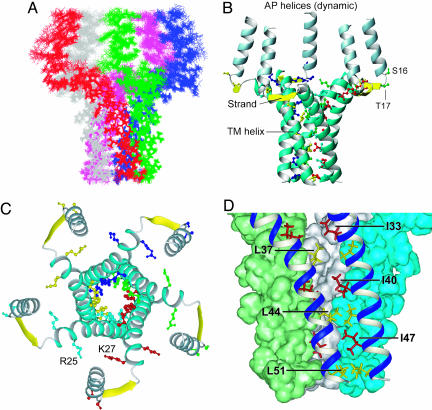
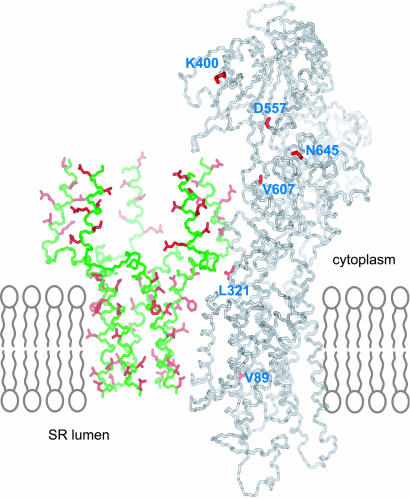
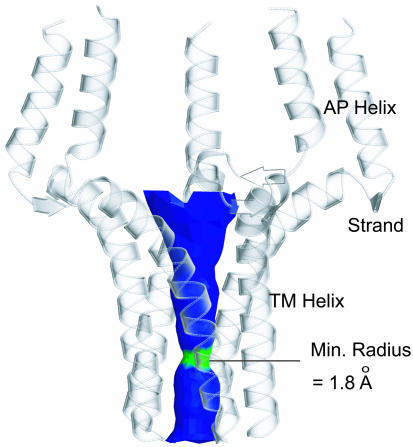
Contraction and relaxation of heart muscle cells is regulated by cycling of calcium between cytoplasm and sarcoplasmic reticulum. Human phospholamban (PLN), expressed in the sarcoplasmic reticulum membrane as a 30-kDa homopentamer, controls cellular calcium levels by a mechanism that depends on its phosphorylation. Since PLN was discovered approximately 30 years ago, extensive studies have aimed to explain how it influences calcium pumps and to determine whether it acts as an ion channel. We have determined by solution NMR methods the atomic resolution structure of an unphosphorylated PLN pentamer in dodecylphosphocholine micelles. The unusual bellflower-like assembly is held together by leucine/isoleucine zipper motifs along the membrane-spanning helices. The structure reveals a channel-forming architecture that could allow passage of small ions. The central pore gradually widens toward the cytoplasmic end as the transmembrane helices twist around each other and bend outward. The dynamic N-terminal amphipathic helices point away from the membrane, perhaps facilitating recognition and inhibition of the calcium pump.


Figures

Fig. 1.
Fig. 1.
NMR characterization of PLN pentamer. (A) SDS/PAGE of PLN reconstituted in 200 mM DPC and SDS under reducing conditions. Lane 1 shows the molecular mass marker. In lanes 2 and 3, PLN was reconstituted in DPC and SDS, respectively, and was loaded on the gel without boiling. For lane 4, the DPC-reconstituted sample was boiled for 30 min before loading and pentamers were disrupted. The PLN concentration (0.02 mM) is the same in lanes 2-4. (B) A 750-MHz 1H-15N transverse relaxation-optimized spectroscopy spectrum of 0.2 mM PLN pentamer in DPC. Each peak represents a backbone NH moiety with residue number labeled. The C5 rotational symmetry is manifested in the presence of one set of 50 amide peaks. (C) The products of 15N longitudinal (R1) and transverse (R2) relaxation rates used to probe variations in chemical exchange (26); the rates were recorded at 1H frequency of 600 MHz by using experiments that closely followed that of Farrow et al. (45). (D) The different ratios of R2 to R1 for AP and TM helices indicate that the AP helices are mobile relative to the TM helices in the pentamer.
Fig. 2.
Fig. 2.
Intermonomer distance restraints. (A) Strips from the 3D 15N-edited, double-13C-filtered NOESY experiment (16) that was optimized to exclusively observe NOEs between the amide protons of 15N, 13C-labeled subunits and protons not covalently attached to 13C atoms, particularly those of methyl groups. Intermonomer NOEs were unambiguously identified when the experiment was performed on a mixed sample reconstituted with a 1:1 ratio of 15N, 13C-labeled and unlabeled subunits (two left strips). As a negative control (two right strips), the same experiment was recorded for a pure 15N, 13C-labeled sample with measurement time scaled to match the spectral intensity of the mixed sample. The three intermonomer NOEs shown here (labeled with stars) correspond respectively to (HN42i, HD39i+1), (HN 48i, HD47i+1), and (HN46i, HD48i-1) proton pairs, where the monomer index (i) increases in the counterclockwise direction as in B. The two strong NOEs near 2.4 ppm are intramonomer NOEs to the HS of C41 and C46. They are observed because HS of Cys is not attached to 13C. (B) Heptad repeat diagram illustrating nine unambiguous intermolecular NOEs (dashed lines) between adjacent subunits. The lengths of the dashed lines do not reflect relative interproton distances.
Fig. 3.
Fig. 3.
Overall structure of the PLN pentamer. (A) Average rms differences between 20 lowest energy structures and their mean (0.61 Å for backbone and 1.1 Å for heavy atoms). (B and C) Ribbon representations of the side and top view of the pentamer structure, respectively. The yellow strands shown here do not represent β-strands; they are used to emphasize that residues 18-20 have backbone dihedral angles similar to that of β-strands. The side chains of important residues are shown in different colors for different subunits, including those involved in the zipper interaction, the positively charged R25 and K27 that may be important for keeping the adjacent TM helices away from each other at the N terminus, as well as the phosphorylation sites of S16 and T17 next to the hinge joining the AP helix and the strand. Protons are not displayed here for clarity. (D) A close-up view of residues (labeled) involved in the Leu/Ile zipper interaction, as well as the tight van der Waals packing between neighboring subunits. Pictures were generated by using the program molmol (46).
Fig. 4.
Fig. 4.
A model for initial recognition between the PLN pentamer and SERCA. The backbones of PLN and SERCA are colored in green and gray, respectively. PLN residues important for SERCA interaction as indicated by mutagenesis studies are colored in red, including E2, V4, L7, R9, I12, and R14 of the AP helix (34) and L31, N34, F35, I38, L42, I48, V49, and L52 of the TM helix (3). The model of SERCA was derived from that for the E2 form of rabbit SERCA1a (PDB ID code 1IWO); residues from the proposed groove in the extramembrane domain where PLN AP helix bind are shown in red, including K400, D557, V607, and N645.
Fig. 5.
Fig. 5.
The pore surface calculated by using the program hole (47) and displayed by molscript (48) and raster3d (49). The region of the channel colored in green is only wide enough to allow passing of one water molecule, whereas the blue portion can accommodate two or more water molecules.

References

    1. MacLennan, D. H. & Kranias, E. G. (2003) Nat. Rev. Mol. Cell. Biol. 4, 566-577. - PubMed
    1. Reddy, L. G., Jones, L. R. & Thomas, D. D. (1999) Biochemistry 38, 3954-3962. - PubMed
    1. Kimura, Y., Kurzydlowski, K., Tada, M. & MacLennan, D. H. (1997) J. Biol. Chem. 272, 15061-15064. - PubMed
    1. Kovacs, R. J., Nelson, M. T., Simmerman, H. K. & Jones, L. R. (1988) J. Biol. Chem. 263, 18364-18368. - PubMed
    1. Zamoon, J., Mascioni, A., Thomas, D. D. & Veglia, G. (2003) Biophys. J. 85, 2589-2598. - PMC - PubMed

Publication types

MeSH terms

Substances

Associated data

LinkOut - more resources